Figure 2

Download original image
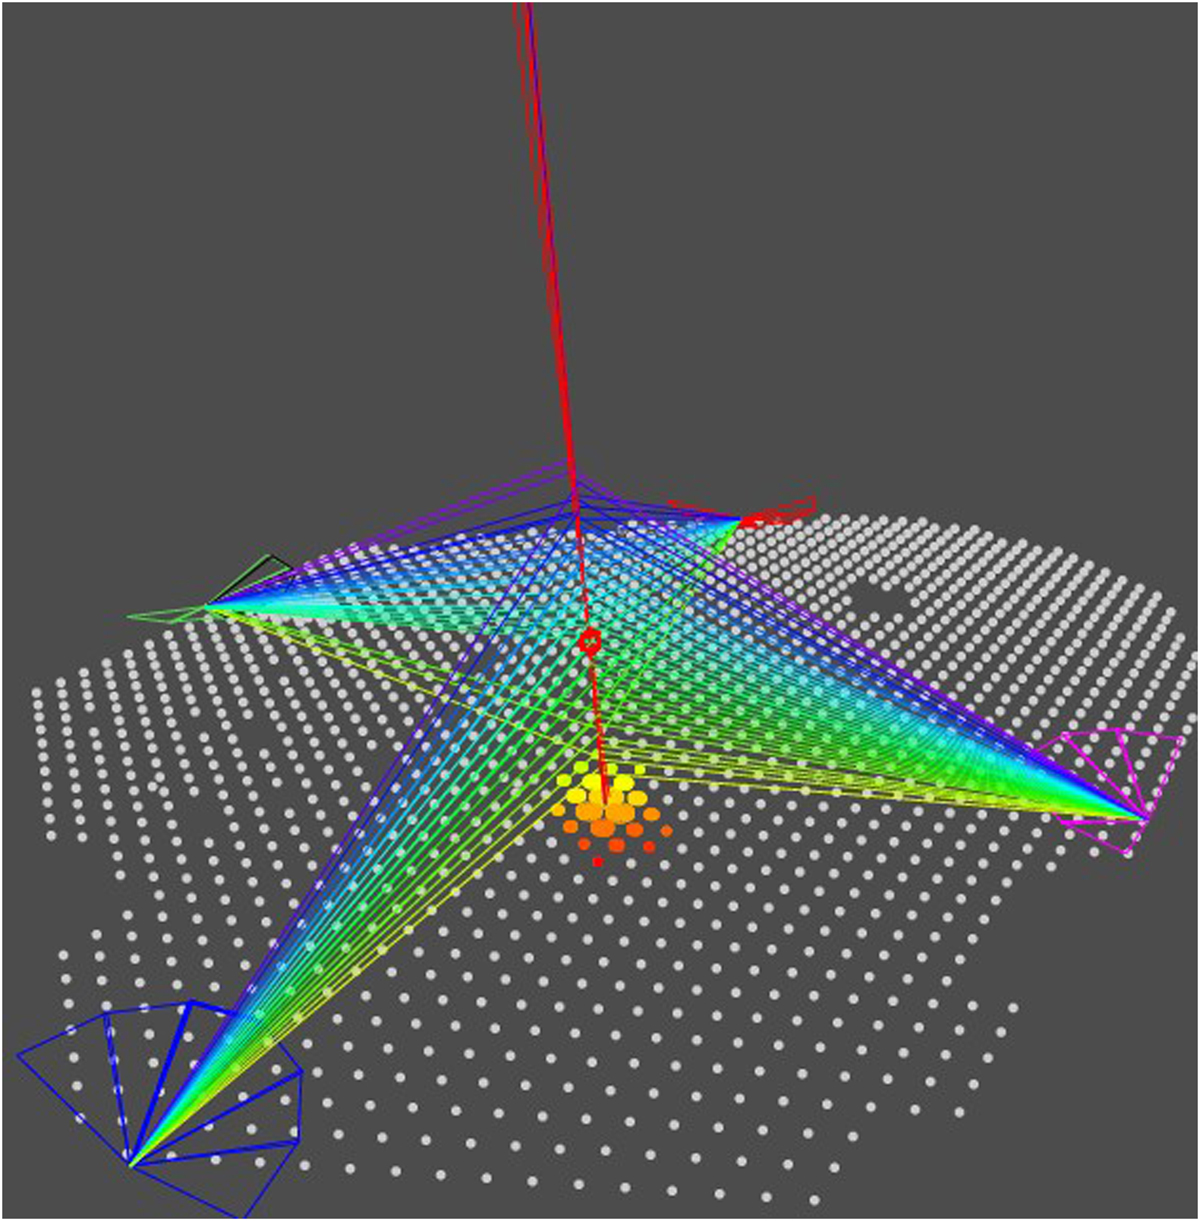
Representation of an event reconstructed by the Pierre Auger Observatory hybrid detection technique. The white dots corresponds to the WCD making up the SD, with the colored ones being the WCD activated by the shower. The four polygons around the SD are the buildings where the fluorescence telescopes are located and the straight red line is the axis of an EAS hitting the array.
Current usage metrics show cumulative count of Article Views (full-text article views including HTML views, PDF and ePub downloads, according to the available data) and Abstracts Views on Vision4Press platform.
Data correspond to usage on the plateform after 2015. The current usage metrics is available 48-96 hours after online publication and is updated daily on week days.
Initial download of the metrics may take a while.