Open Access
Figure 5
Download original image
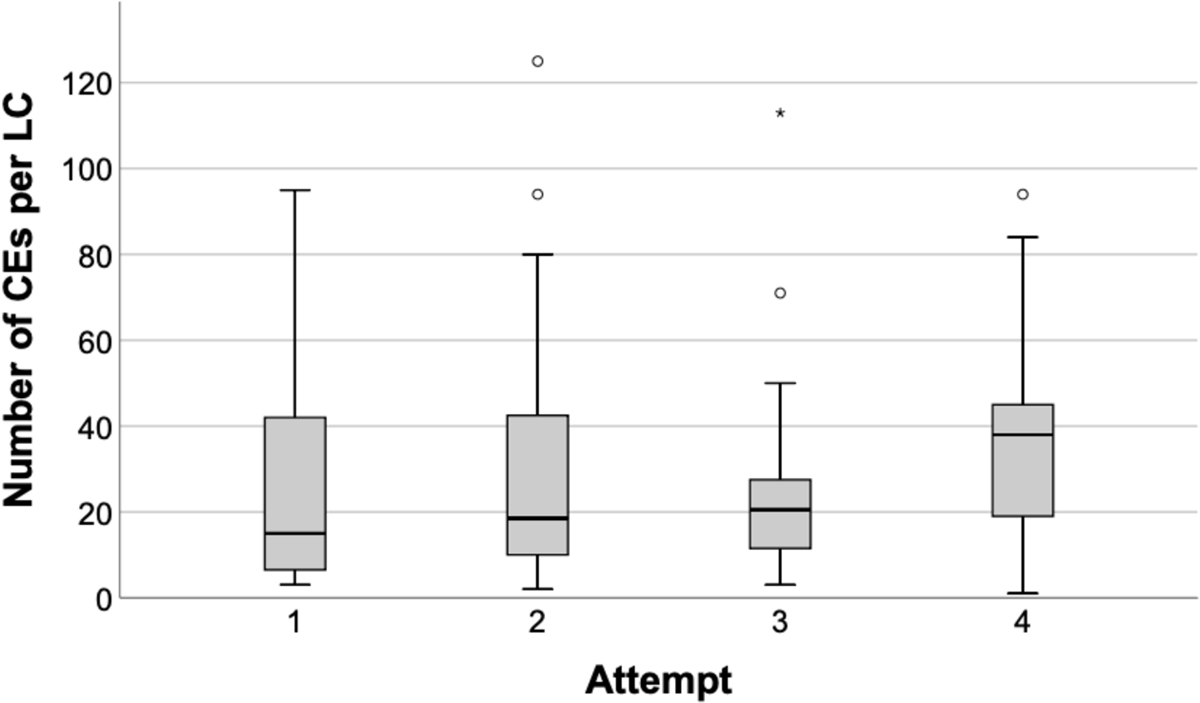
Number of CEs per LC in the total population broken down into attempts 1–4, per box plot n = 24 subjects with one LC per attempt (total 96 LCs with 24 LCs per boxplot).
Number of CEs per LC in the total population broken down into attempts 1–4, per box plot n = 24 subjects with one LC per attempt (total 96 LCs with 24 LCs per boxplot).