Figure 1
Download original image
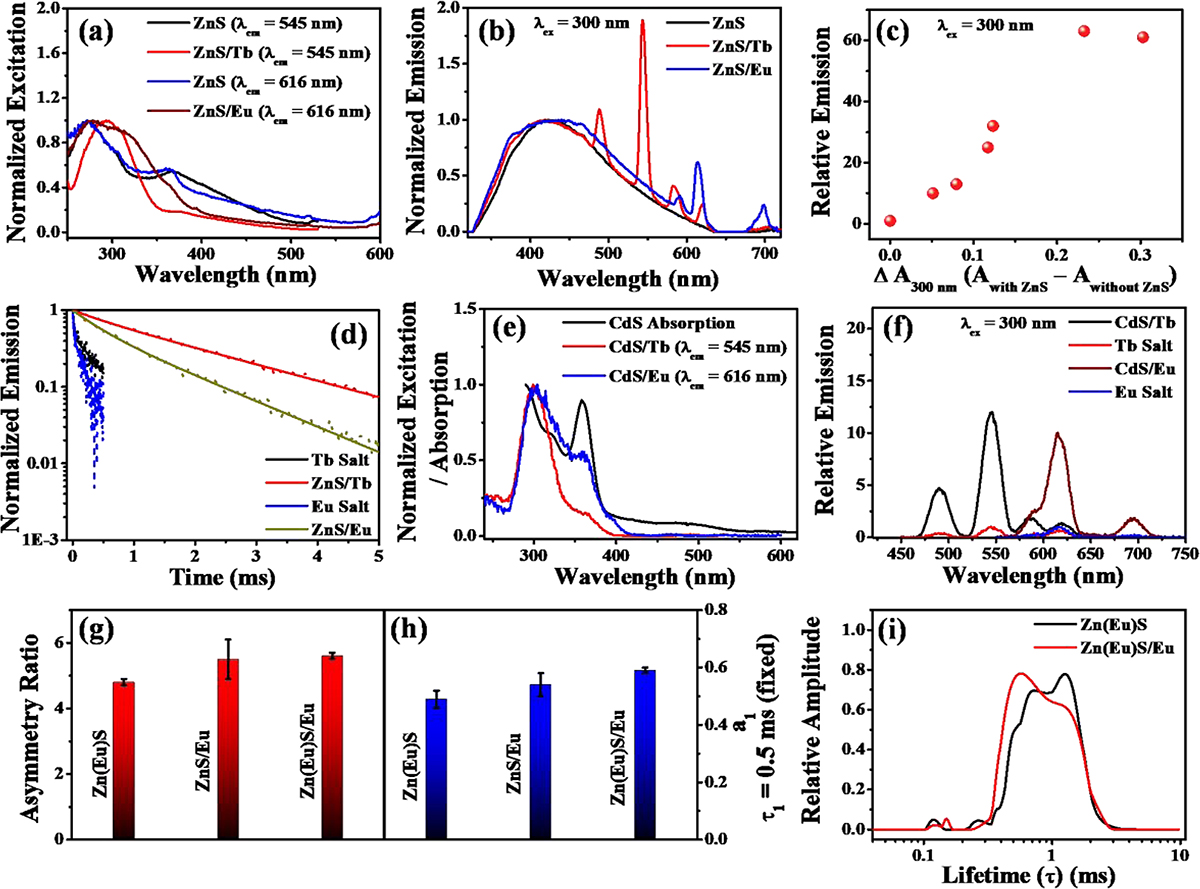
Luminescence excitation and emission spectra of the ZnS, ZnS/Tb, and ZnS/Eu NPs are shown in panels (a) and (b), respectively. Panel (c) shows the Eu3+ emission trend when ZnS NPs are gradually added to the dispersion. The Ln3+ emission lifetime decay profiles in the ZnS/Tb and ZnS/Eu NPs are shown in panel (d), with the corresponding profiles of freely floating Ln3+ included. Luminescence excitation and emission spectra of the post-synthetically treated CdS/Tb and CdS/Eu NPs are shown in panels (e) and (f), respectively. The electronic absorption spectrum of the CdS NPs is also included in panel (e) for comparison. Panels (g), (h), and (i) show the trends in Eu3+ asymmetry ratio, emission lifetime, and emission lifetime distribution, respectively. (Adapted with permission from Reference [87], Copyright 2013 American Chemical Society).