Figure 4
Download original image
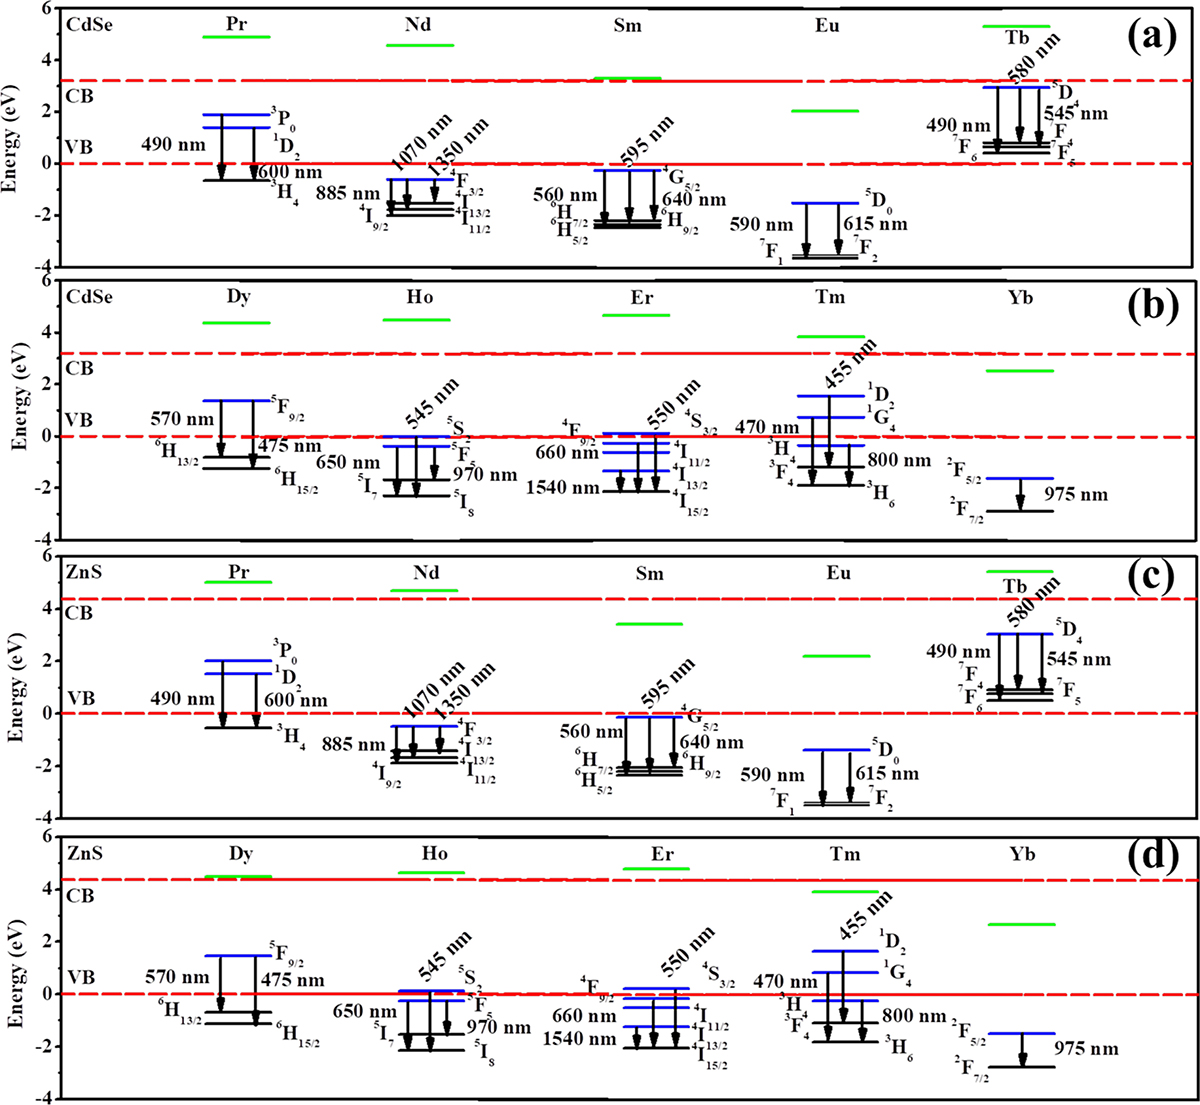
Relative energy level schematic with placement of Ln3+ ground and luminescent energy levels with respect to the valence and conduction bands of the host material is shown. Ground and luminescent energy levels in each case are represented by black and blue solid lines, respectively. Prominent luminescence transitions are shown with downward arrows in each case. Ln2+ ground energy levels are indicated by green horizontal lines. These energy levels are positioned following a method proposed by Dorenbos [96, 97] and later adopted by us, [78–81, 90, 98] and relies on inputs of host independent universal binding energy trend of Ln3+ and the charge transfer energy from anion valence band of host material to Ln3+ moieties. (Adapted with permission from Reference [90], Copyright 2019 Elsevier).