Figure 9
Download original image
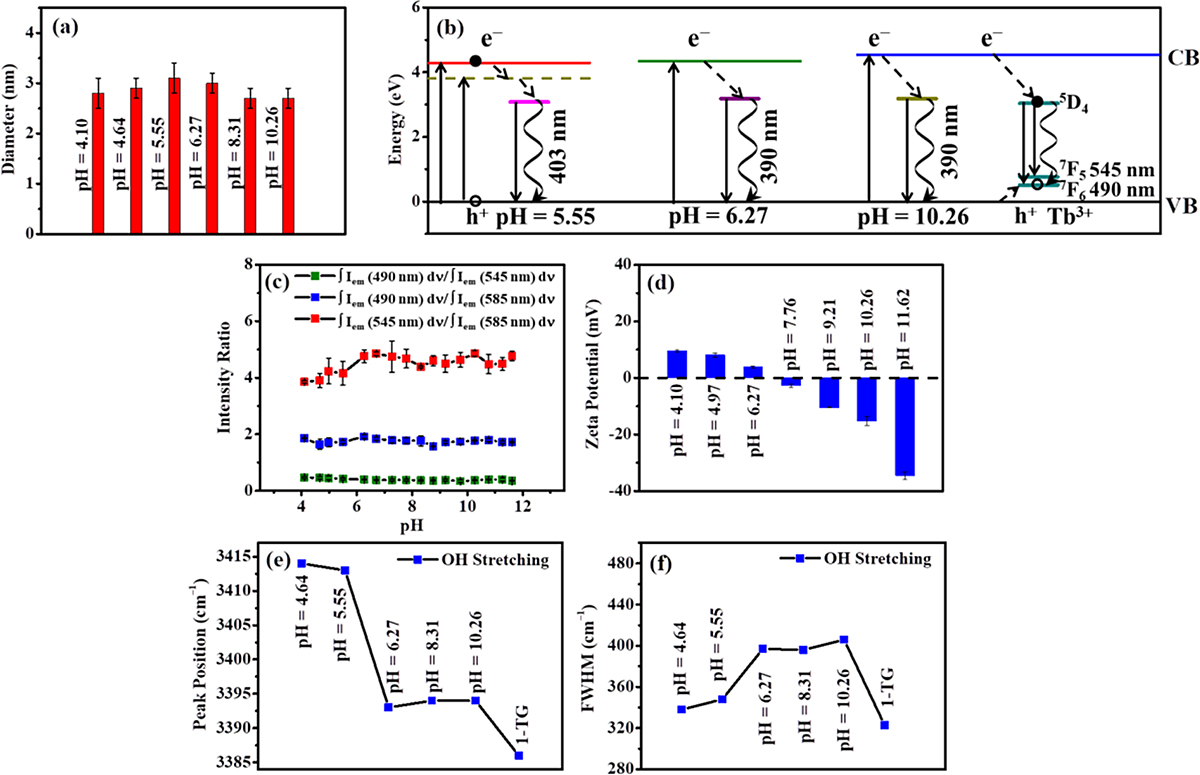
The size of the Zn(Tb)S NPs as a function of pH that is adjusted post-synthetically is shown in panel (a). Panel (b) shows the relative energy level schematic of the Zn(Tb)S NPs in different pH. A comparison of Tb3+ emission spectral shape is shown in panel (c). The zeta potential values, and the trends in spectral characteristics of OH stretching absorption band are shown in panels (d) and (e) - (f), respectively. (Adapted with permission from Reference 108, Copyright 2020 American Chemical Society).