Figure 4
Download original image
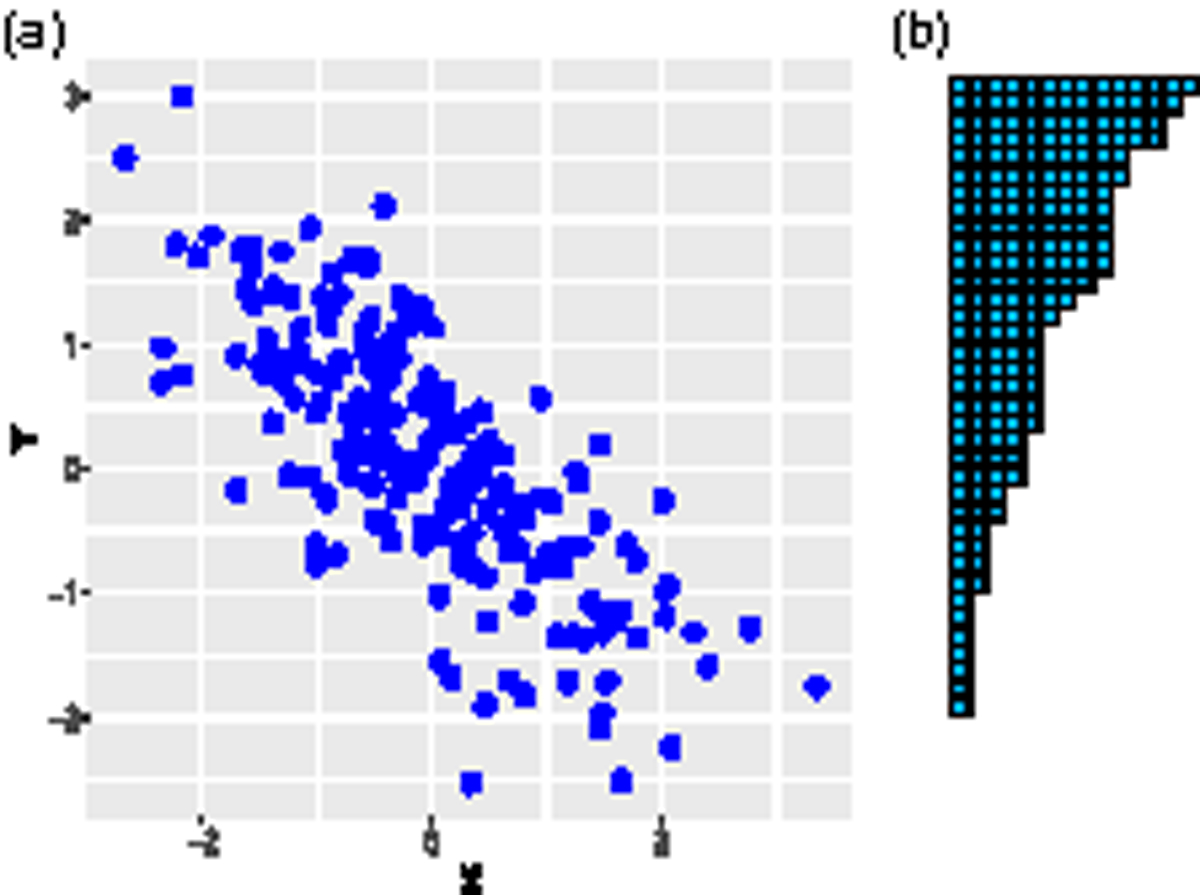
(a) Scatter plot ![]() vs. Y. (b)Young tableau shape. For a sample of size n = 200 of (X, Y) bivariate Normal distribution with correlation −0.7.
vs. Y. (b)Young tableau shape. For a sample of size n = 200 of (X, Y) bivariate Normal distribution with correlation −0.7.
(a) Scatter plot ![]() vs. Y. (b)Young tableau shape. For a sample of size n = 200 of (X, Y) bivariate Normal distribution with correlation −0.7.
vs. Y. (b)Young tableau shape. For a sample of size n = 200 of (X, Y) bivariate Normal distribution with correlation −0.7.