Open Access
Figure 2
Download original image
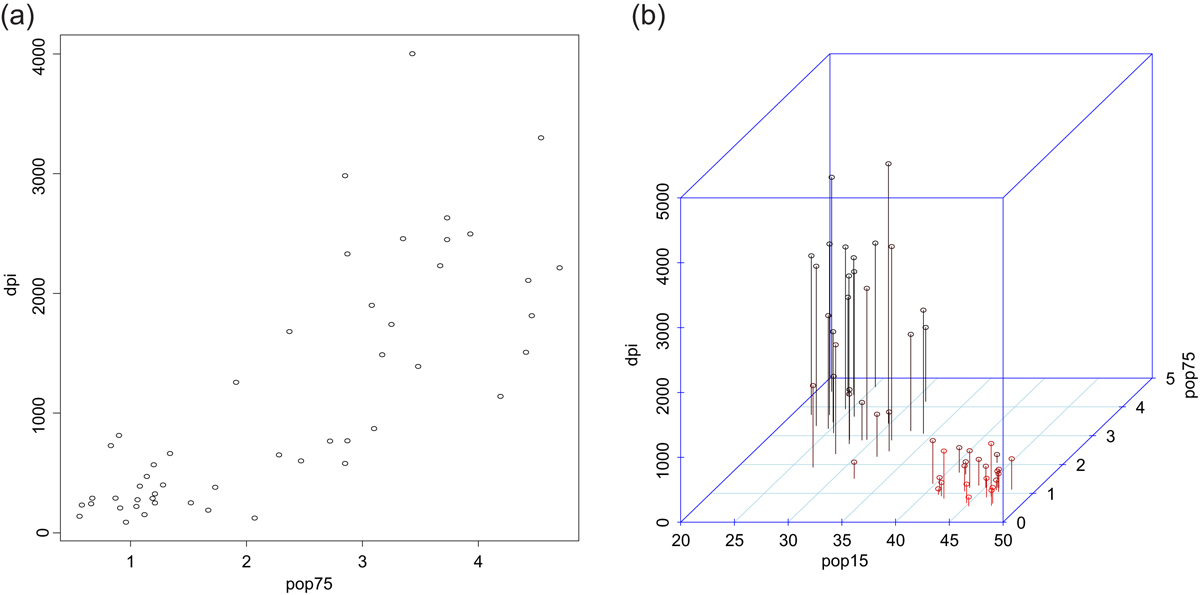
(a) Percentage of the population over 75 years old (pop75) vs. per-capita disposable income (dpi). (b) Scatterplot between pop15, pop75 and dpi, from red to black color in increasing order in relation to the “pop75” axis. Observations of n = 50 countries (see [6]).