Open Access
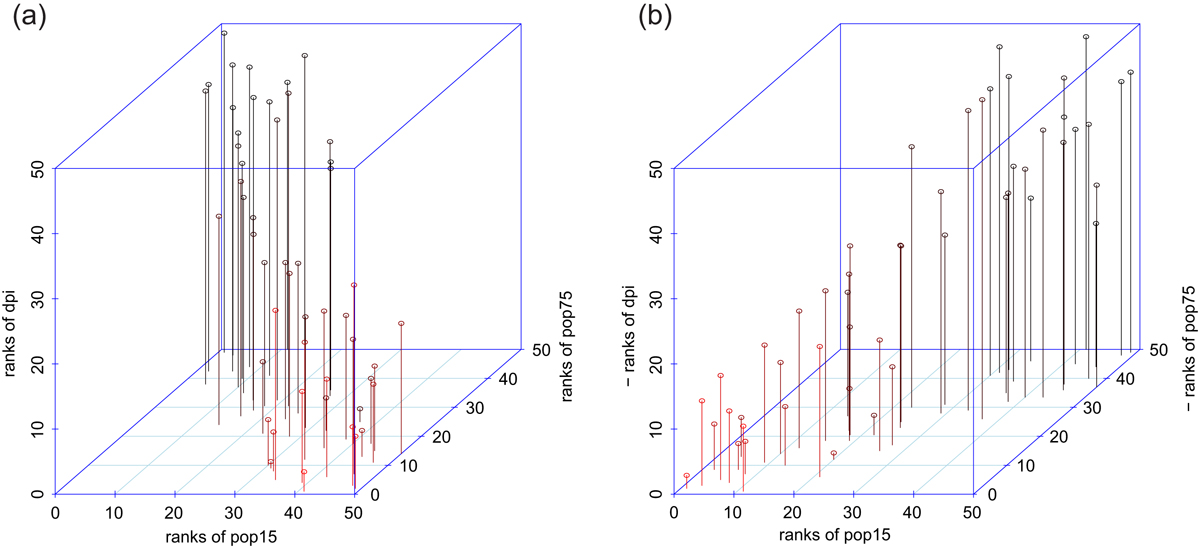
Figure 3
Download original image
(a) Scatterplot between ranks of pop15, ranks of pop 75 and ranks of dpi, from red to black color in increasing order in relation to the “ranks of pop75” axis. (b) Scatterplot between ranks of pop15, – ranks of pop 75 and – ranks of dpi, since ![]() From red to black color in increasing order in relation to the “– ranks of pop75” axis.
From red to black color in increasing order in relation to the “– ranks of pop75” axis.