Figure 4

Download original image
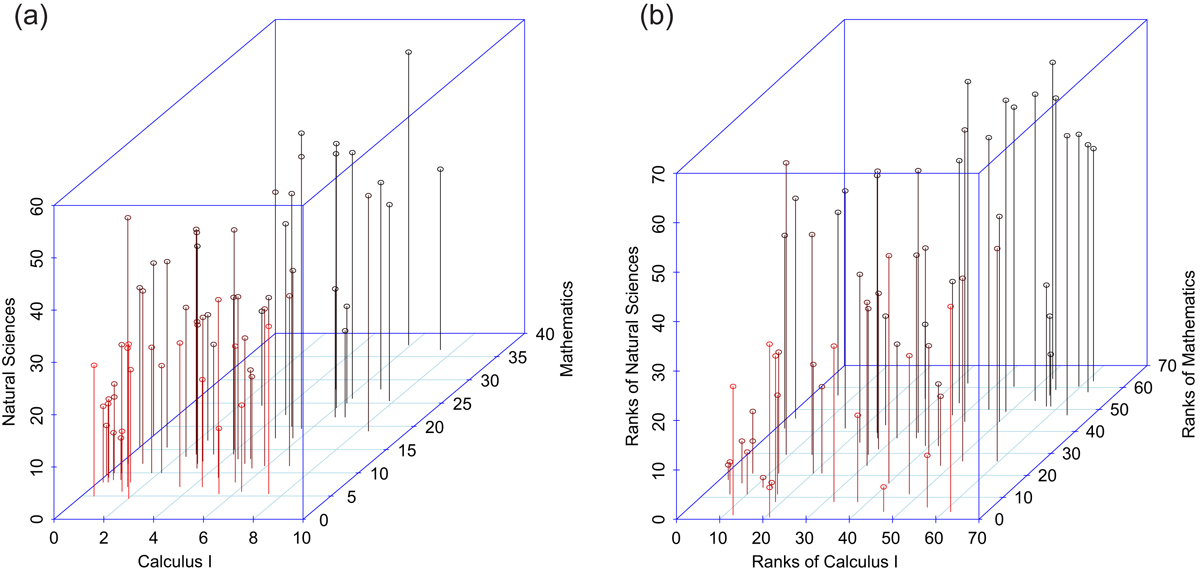
Data of 2013. (a) Scatterplot between Calculus I, Mathematics and Natural Sciences, from red to black color in increasing order in relation to the “Mathematics” axis. (b) Scatterplot between ranks of Calculus I, ranks of Mathematics and ranks of Natural Sciences, from red to black color in increasing order in relation to the “Ranks of Mathematics” axis.
Current usage metrics show cumulative count of Article Views (full-text article views including HTML views, PDF and ePub downloads, according to the available data) and Abstracts Views on Vision4Press platform.
Data correspond to usage on the plateform after 2015. The current usage metrics is available 48-96 hours after online publication and is updated daily on week days.
Initial download of the metrics may take a while.