Open Access

Figure 1

image

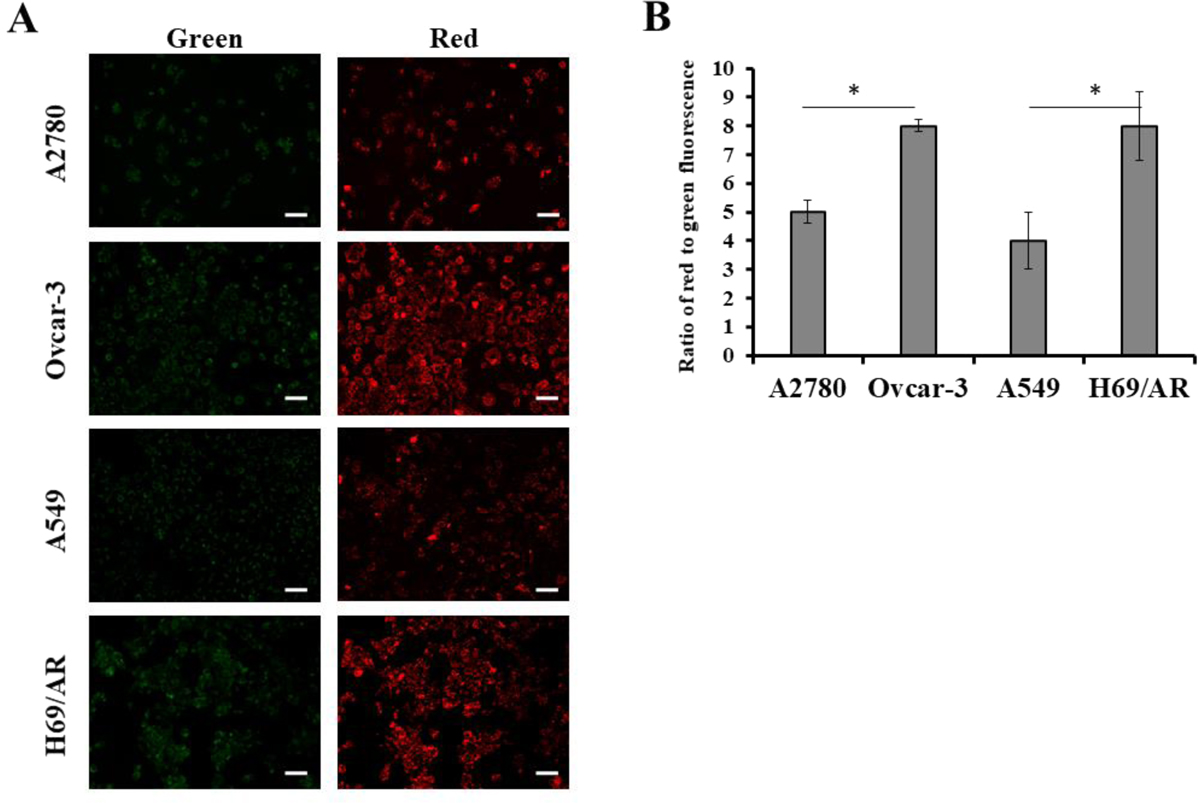
Download original image

Determination of JC-1 Dye accumulation. A: Fluorescence micrographs with green and red filters of indicated cell lines after dye staining protocol. Scale bar represents 100 μm. B: Ratio of red to green fluorescence in indicated cell lines after dye staining protocol. Values represent mean ± standard deviation from 3 independent experiments. *p < 0.05, Student’s t test.

Current usage metrics show cumulative count of Article Views (full-text article views including HTML views, PDF and ePub downloads, according to the available data) and Abstracts Views on Vision4Press platform.

Data correspond to usage on the plateform after 2015. The current usage metrics is available 48-96 hours after online publication and is updated daily on week days.

Initial download of the metrics may take a while.