Figure 1
Download original image
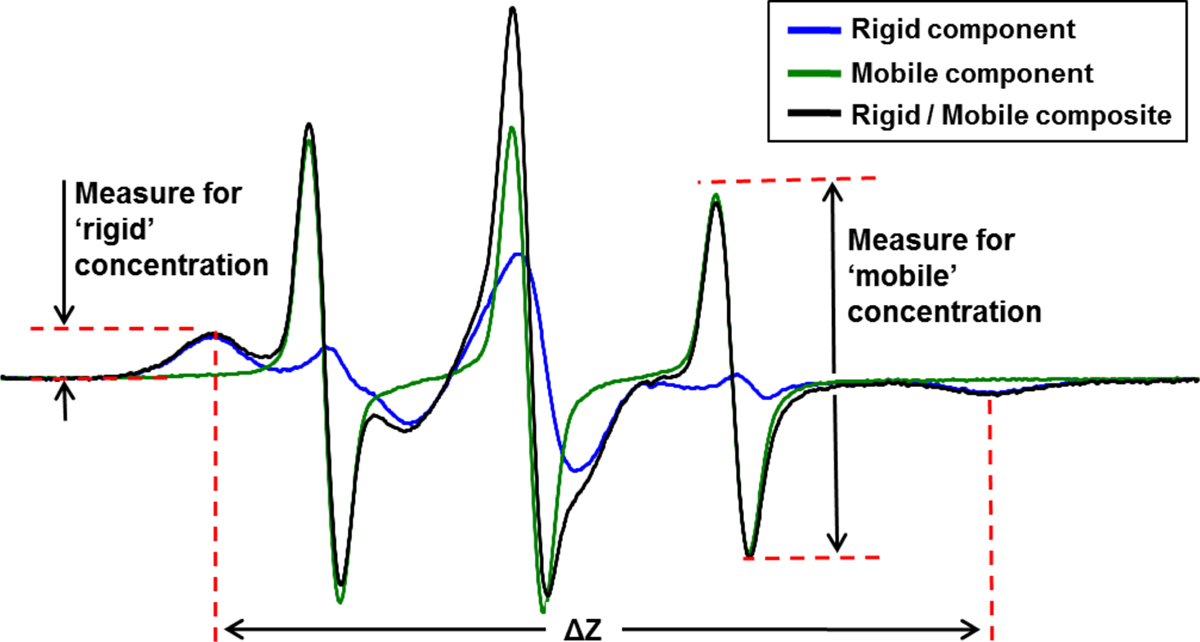
ESRSL spectra of a 64 kDa protein (BSA) spin-labeled at a “mobile” site (green line) or at a rigid site (blue line). The third, “composite” ESRSL “spectrum” (black line) is obtained by summation of the mobile and rigid spectra. This composite spectrum is typical for the case where both rigid and mobile populations are present. Key areas of the composite spectrum reflect only the contributions of either the rigid or mobile population, so they can be quantified independently: the height of the low-field (left most) ESRSL peak varies in proportion to the rigid population, and the height of the sharp, high-field peak varies in proportion to the mobile population. Furthermore, the parameter ΔZ is a qualitative metric for the nature of the rigid population.