| Issue |
4open
Volume 5, 2022
Proteomics, Proteolysis and Amyloid beta
|
|
|---|---|---|
| Article Number | 11 | |
| Number of page(s) | 11 | |
| Section | Life Sciences - Medicine | |
| DOI | https://doi.org/10.1051/fopen/2022010 | |
| Published online | 04 July 2022 | |
Research Article
Realtime, continuous assessment of complex-mixture protease and protease inhibitor activity
1
Department of Chemical & Biomolecular Engineering, University of Illinois at Urbana-Champaign, Urbana, IL 61801, USA
2
New Liberty Proteomics Corporation, New Liberty, KY 40355, USA
* Corresponding author: This email address is being protected from spambots. You need JavaScript enabled to view it.
Received:
6
May
2022
Accepted:
18
May
2022
Abstract
Recently the treatment PAXLOVID™ (nirmatrelvir co-packaged with ritonavir) was authorized for use as a treatment for COVID-19. The presumed mechanism of action of the treatment, an inhibitor of a Sars-Cov-2 “3CL” protease, continues decades-long interest in viral protease inhibition in the fight against pathogenic viruses (e.g., HIV protease inhibitors). Proteolysis assay methods vary widely, roughly bounded by interrogation of basic biochemistry and high-throughput, early-stage drug screening. Reported here are methods that provide unique and biologically relevant characterization of proteolysis and protease inhibition. A companion report provides evidence that these methods show promise for drug and basic biological discovery, especially for early detection of potential side effects. Electron spin resonance spectroscopy and spin labeling (ESRSL) of whole proteins are leveraged to monitor reactants and products of whole-protein digestion through differentiation of angular mobility of those products and reactants. These proof-of-concept data demonstrate consistency with prior art for all possible combinations of four proteases, two whole-protein substrates and three inhibitors. Thus, ESRSL is shown to uniquely and widely interrogate proteolysis of natural, whole-protein, substrates insuring the biological relevance of results.
Key words: Proteomics / Methodology / Proteolysis
© S.-E. Leonard et al., Published by EDP Sciences, 2022
 This is an Open Access article distributed under the terms of the Creative Commons Attribution License (https://creativecommons.org/licenses/by/4.0/), which permits unrestricted use, distribution, and reproduction in any medium, provided the original work is properly cited.
Introduction
Proteases are pivot points of activity in all biological systems [1]. About 2% of all mammalian genes have been estimated to code for proteases, implying that over 500 distinct proteases may exist in humans [2, 3]. Once thought to be simple degradation engines, proteases are increasingly seen as pathway control agents for key processes ranging from blood clotting [4] to cell death [5]. Indeed, proteases have been shown or are postulated to be associated with a wide variety of disease conditions, including heart disease, cancer, Alzheimer’s disease, arthritis, HIV/AIDS, Hepatitis C, inflammation, and diabetes mellitus [6–17]. Protease inhibitors are already being used to combat a variety of diseases, e.g., PAXLOVID for COVID-19 [18] and multiple treatments for HIV [19]. Therefore, the study of proteases and the identification of new protease inhibitors is an active area of research. Commercially, proteases appear in laundry detergents, pesticides, meat tenderizers, and digestive aids [20]. They are also exploited or are key actors in the production of cheese, yogurt, meat, beer, and bread [21, 22]. In the laboratory proteases are routinely employed in the management of cell cultures and the preparation of protein samples for mass spectrometry [23]. Despite these many applications, characterization of protease activity and inhibition remains a challenge due to the complex nature of the protease reaction.
Proteases act on whole proteins through amide bond cleavage. In general, cleavage of a single bond in a whole-protein substrate creates two protein fragments that then each become potential next substrates for the protease. Continuing this process through only a few cycles leads to possible product/substrate profiles that are comprised of fragments with molecular weights ranging from that of a single amino acid to that near the original whole-protein substrate, as evidenced by liquid chromatography [24, 25]. Scission at a given amide linkage may wholly disrupt secondary/tertiary structure leading to a disordered or wholly denatured polypeptide. In contrast, scission at another linkage may leave the protein largely intact.
Existing methods to characterize protease activity exploit different aspects of the protein digestion process. Perhaps the oldest of the methods still in use exploits a yellow-to-purple colorimetric shift upon binding of ninhydrin to free amino acids [26]. A related method follows the formation of a blue-appearing complex formed between tyrosine and a phenolic reagent [27]. Both of these methods detect proteolysis products rather late in the cycle as they rely on the appearance of free amino acids. Alternatively, peptide-substrates have been employed to gauge protease activity, often custom-designed for a specific protease. More recently, peptide-substrates have featured inclusion of fluorophores in combination with detection by fluorescence-based spectroscopies; e.g., fluorescence polarization [28] or fluorescence resonance energy transfer [29–32]. Such approaches can serve as useful screening or selective identification tools prior to more in-depth investigation. In-depth information can be derived from whole-protein substrate work that exploits separation methods, e.g., high performance liquid chromatography either by itself [24, 25] or in combination with mass spectrometry [33–35]. Newer approaches include the use of proteases immobilized on cantilevers whose deflection can be correlated with protease activity [36].
Here, we report a spin labeling electron spin resonance (ESRSL) based method, to screen for protease activity and inhibition using intact, whole-protein substrates. Over four decades, ESRSL has proven useful in the differentiation of protein function and/or activity based on measurement of differences in angular mobility [37–42]. Two earlier ESRSL studies [43, 44] monitored the self-digestion of proteins on erythrocyte membranes and HIV protease, but neither attempted to establish a generalized methodology. The generally applicable method we report here uses ESRSL to monitor all stages of whole protein digestion by proteases, as well as the effect of different inhibitors on this process. ESRSL is shown to spectroscopically separate complex product/reactant mixtures in real time thus eliminating the need for physical separation or interruption of the reaction. The methods also lend themselves to evaluation of potential therapeutics for the desired activity plus anticipation of potential side effects and disease severity as addressed in the companion article [47], “Rampant Proteolysis at the Intersection of Therapy-Induced Hypoalbuminemia and Acute Pancreatitis.”
Materials and methods
Materials
Bovine serum albumin (BSA), bovine hemoglobin A (HgA), a secondary source of bovine pancreatic trypsin, papaya latex papain, pineapple stem bromelain, synthetic leupeptin hemisulfate, microbial chymostatin and the spin label 4-Maleimido-2,2,6,6-tetramethyl-1-piperi-dinyloxy, free radical (MAL6) were purchased from Sigma-Aldrich, St. Louis MO. Soybean trypsin inhibitor, bovine pancreatic α-chymotrypsin, and the primary source of bovine pancreatic trypsin were purchased from Worthington Biochemical Co., Lakewood NJ. Phosphate buffered saline (PBS) was purchased from Thermo Fisher Scientific, Waltham MA. Stock solutions of BSA and HgA were made to 160 μM in PBS (typically 3 mL each). Stock solutions of proteases and inhibitors were Made to 600 μM in PBS (typically 0.5–1 mL each). A 40 mM stock solution of MAL6 was prepared in DMSO (0.5 mL).
Sample preparation
160 μM stock solutions of the substrates (BSA and HgA) were labeled with equimolar amounts of MAL6 and allowed to incubate for 30–60 min sat room temperature. Solvent dialysis (1 to 106) was achieved through three, successive 1:100 dialyses against PBS at room temperature. Solutions for the ESRSL experiments were prepared through mixing of protease, inhibitor and/or buffer aliquots in a 0.6 mL Eppendorf tube to reach a final concentration of 100 μM for each of the reaction components. For solutions containing both protease and inhibitor, the inhibitor was introduced prior to the protease. Test solutions were transferred into 80 μL capillaries to a certain sample height, sealed with Critoseal® at one end and placed in a 5-mm (ID) quartz sample tube. The loaded quartz tubes were placed in the ESRSL resonator and tuning adjusted to achieve critical coupling. All ESRSL observations were performed at room temperature, typically 22 °C.
ESRSL data collection
For each standard and each kinetic time point, four 30-second ESRSL spectra were obtained, and their values averaged to reduce noise. Therefore, each reported data point represents 2 min of averaged activity. Time equals zero is defined as the moment at which the protease was introduced to the sample by vigorous pipetting, yielding a mixed solution. Upon introduction of protease to labeled substrate a computer-based timer, embedded in custom software designed for analysis, was started. The software calculated the times at which the initial and subsequent kinetic points were to be collected at pre-determined intervals. Actual start times were also noted and recorded. The raw ESRSL data, as well as all pertinent instrument and solution data were collated into a single, custom database.
The data are reported at the half-way point of the 2-minute period of data collection, specifically 7, 24, and 41 min after protease introduction. The timing was designed such that three protease digestion samples could be run concurrently, with start times staggered by 6-minute intervals. ESRSL data were collected on a Varian E-112 spectrometer equipped with TE102 resonators. Occasionally, a field/frequency lock accessory was employed. The majority of observations were obtained at 2.5 gauss modulation amplitude and a microwave power of 32 mW, with settings selected to optimize signal/noise. All instrument settings were recorded and employed as appropriate by the analysis software as discussed below.
ESRSL data analysis
To estimate the error in the data (e.g., in peak height) due to sample variation and to fluctuations in the spectroscopic measurements, we prepared four identical samples containing BSA only and took four sets of four averaged spectra for each sample. The spread in the measured peak heights for these 16 resulting spectra indicated that the error in these measurements is less than 1.3%. This error was applied directly for primary concentration analysis for “Rigid” spectra as shown in Figure 1. By comparison “Mobile” spectra (Fig. 1) are 55 times more easily detected. Therefore, an error of 0.02% was applied to all Mobile concentration analyses. We also performed the same analysis based on 16 spectra of a single sample, but that did not noticeably reduce the amount of noise. All data points reported in this work are the result of averaging four spectra recorded within a 2-minute time interval as explained above.
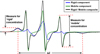 |
Figure 1 ESRSL spectra of a 64 kDa protein (BSA) spin-labeled at a “mobile” site (green line) or at a rigid site (blue line). The third, “composite” ESRSL “spectrum” (black line) is obtained by summation of the mobile and rigid spectra. This composite spectrum is typical for the case where both rigid and mobile populations are present. Key areas of the composite spectrum reflect only the contributions of either the rigid or mobile population, so they can be quantified independently: the height of the low-field (left most) ESRSL peak varies in proportion to the rigid population, and the height of the sharp, high-field peak varies in proportion to the mobile population. Furthermore, the parameter ΔZ is a qualitative metric for the nature of the rigid population. |
The raw ESRSL data was normalized for any changes in instrument or solution conditions. Linear baseline correction was performed prior to automated determination of peak locations and heights. Broad peaks were subjected to a 15-point, digital filtering procedure while sharp peaks were examined without filtering. Concentrations of reaction products were estimated by comparison of corrected, normalized ESRSL data to relevant standards (e.g., labeled substrate ± inhibitor, complete digestion endpoints). The reactions were followed by monitoring the intensity of the sharp high-field peak (mobile population) or the broad low-field peak (rigid population). The resulting kinetic data in the form of peak heights as a function of time were exported to MS Excel, which was used to create graphs and histograms.
Results
ESRSL differentiation of molecular mobility
This work reports the study of whole protein substrate digestion by different proteases using ESRSL which monitors changes in angular mobility of the spin-labeled proteins. Figure 1 shows ESRSL spectra of a 64 kDa protein in an aqueous solution and spin-labeled at different cysteine residues. The angular mobility of a “rigid” protein-bound label can be three orders of magnitude slower than the rate of a “mobile” protein-bound label, giving rise to distinct ESRSL spectra (Fig. 1). The impact of functionalizing a single site on protein structure and function is typically minimal. A spin label like MAL6 (Fig. 2) increases the size of, e.g., a cysteine residue, to that approximating tryptophan, while changing the overall molecular weight of the protein by less than 0.3%. Analogues to functionalizing proteins with fluorescent labels, spin labels can be introduced selectively at a variety of sites, including terminal amino groups, other secondary and tertiary amines, and carboxyl termini. The angular mobility changes dramatically depending on whether the site is associated with maintenance of the secondary or tertiary structure of the protein. Prior ESRSL results reflect these site-to-site mobility differences [38]. Note, however, that rapid angular mobility can arise both from small molecules and from mobile sites within a large molecule. In Figure 1 the three-line “mobile” spectrum may be that of, e.g., a two to three kDa peptide or that of a mobile site in a much larger protein. The “rigid” spectrum is that of a site reflecting mostly the rotational motion of the protein as a solid body, equivalent to a 60 kDa or larger protein. If both types of sites are present, e.g., digested protein alongside the original protein substrate or a large fragment of the original substrate, a “composite” spectrum is observed, as shown in Figure 1. Distinctive features of both a rigid population and a mobile population are apparent. Mobile populations tend to be detected preferentially in ESRSL, i.e., for a given change in concentration of the mobile population larger changes in ESRSL peaks will be observed than for an equivalent concentration change of a rigid population. In summary, this study demonstrates that proteolysis can be tracked by assessing concentration changes of both the rigid and mobile populations independently.
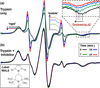 |
Figure 2 (a) ESRSL spectra of MAL6-labeled BSA (0 min, black) as well as 7, 24, and 41 min after addition of trypsin (green, blue, and red curves). Note the changes in the spectral features: the increase in the intensity of the three main peaks (mobile population), the decrease in the intensity of the leftmost peak (rigid population) and the shift in the position of some of the peaks on the right (reduction in ΔZ, see inset) indicating a decrease in molecular weight of the rigid population. (b) ESRSL spectra for the same experiment as part (a), but now in the presence of a trypsin inhibitor. |
Three metrics based on changes in spectral features can be used to track the proteolysis process, as indicated in Figure 1: (i) The concentration of the rigid population may be estimated by the height of the low-field or leftmost peak. (ii) The concentration of the mobile population may be estimated by the height of high field (rightmost), sharp peak. In general, tracking changes in the mobile population concentration proves the most reliable and the most amenable to screening applications due to a much greater change in spectral features associated with the mobile population. (iii) The final metric, “ΔZ” (Fig. 1), is a qualitative indicator of the nature of the rigid population. A decrease in ΔZ indicates a decrease in molecular weight of the rigid population.
Tracking Proteolysis in Real Time via ESRSL
Figure 2a shows ESRSL spectra for the proteolysis of labeled BSA treated with trypsin over a 41-minute time period. The spectral features representative of an increase in the mobile population (increase in height of the “mobile” population peak on the right) and those features representative of a decrease in the rigid population (decrease in height of the “rigid” population peak on the left) are evident. Also, the outermost peaks move toward each other (decrease in ΔZ), as highlighted in the inset for the rightmost peak, which indicates a decrease in the molecular weight of the rigid population. In contrast, none of these changes occur if trypsin inhibitor is added to the sample solution prior to addition of the protease (Fig. 2b).
In the subsequent figures we use these ESRSL metrics to track the digestion of two whole-protein substrates (BSA and HgA labeled with MAL6 on cysteinyl sites) by four proteases (trypsin, α-chymotrypsin, papain, and bromelain). In addition, we study the inhibition of the proteolysis process for each substrate-protease combination using three inhibitors (trypsin inhibitor, leupeptin, and chymostatin).
Figures 3a and 3b show a near-symmetric increase and decrease of the mobile and rigid populations, respectively, for the digestion of HgA by α-chymotrypsin, as well as the modulation of the same experiment by three potential inhibitors. The degree of inhibition is evident from either metric, with each metric serving as an internal confirmation of the other. These data show for the first time that ESRSL indeed can be used to track proteolysis of whole-protein substrates.
 |
Figure 3 Increase in mobile population and near-symmetric decline in rigid population over a 41-minute time course. Data shown is that for digestion of HgA by α-chymotrypsin, alone or in the presence of three known protease inhibitors. Error bars for mobile population are too small to be visible at this scale. |
In cases where digestion is less aggressive, the trends are still clearly mirrored for the two concentration metrics, yet the relatively larger statistical error associated with the rigid population begins to approach the differences between the inhibitor curves. Therefore, we used the concentration of the mobile population to monitor the various proteolysis experiments in the absence and presence of the inhibitors.
Comparison to prior art
Figures 4 and 5 present the changes in the mobile population concentration during proteolysis of each of the two substrates (BSA, Fig. 4; HgA, Fig. 5) in the presence of four proteases and three inhibitors. The general trends agree with expectations for the various protease/inhibitor combinations: (i) Trypsin inhibitor is an effective inhibitor of the serine proteases (trypsin and α-chymotrypsin) though it is not effective against the cysteinyl proteases (papain and bromelain) [45]. (ii) Leupeptin is an effective inhibitor for all proteases except α-chymotrypsin [46]. (iii) Chymostatin exhibits modest inhibition of the serine proteases but is a strong inhibitor of the cysteinyl proteases [46]. Together, these extensive datasets and the agreement of the observed trends with expectations, show that ESRSL indeed provides a direct and rapid approach to characterize the effectiveness of different proteases and protease inhibitors.
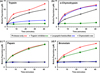 |
Figure 4 Increase in mobile population over a 41-minute time course for digestion of BSA by four proteases: Trypsin, α-chymotrypsin, papain, and bromelain. Each protease acted alone or in the presence of three known protease inhibitors. Error bars are too small to be seen at this scale. |
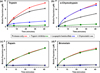 |
Figure 5 Increase in mobile population over a 41-minute time course for digestion of HgA by four proteases: Trypsin, α-chymotrypsin, papain, and bromelain. Each protease acted alone or in the presence of three protease inhibitors. Error bars are too small to be seen at this scale. |
Whole-Protein Substrate Differentiation via ESRSL
Next, we compared the rigid and mobile concentrations for all protein-protease-inhibitor combinations after allowing the reactions to proceed for 24 h (Figs. 6 and 7). The data provide evidence for both protease and substrate differentiation. The digestion profiles for HgA at 24 h (Fig. 6) are in agreement with the corresponding results over the first 40 min (Fig. 5). For example, trypsin inhibitor and leupeptin are shown to be strong inhibitors of trypsin digestion of HgA over the first 40 min (Fig. 5a) as well as 24 h later (Fig. 6a). The same is true for the trypsin inhibitor inhibition of α-chymotrypsin (Figs. 5b and 6b), and for leupeptin and chymostatin inhibition of the cysteinyl proteases papain (Figs. 5c and 6c) and bromelain (Figs. 4d and 6d).
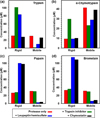 |
Figure 6 Rigid and mobile population concentrations following a 24-hour, room-temperature digestion of HgA by four proteases: Trypsin, α-chymotrypsin, papain, and bromelain. Each protease acted alone or in the presence of three known protease inhibitors. Total substrate concentration was 100 μM. |
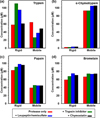 |
Figure 7 Rigid and mobile population concentrations following a 24-hour, room-temperature digestion of BSA by four proteases: Trypsin, α-chymotrypsin, papain, and bromelain. Each protease acted alone or in the presence of three known protease inhibitors. Total substrate concentration was 160 μM. |
Digestion profiles of the second whole-protein substrate, BSA (Fig. 7), exhibited some similar trends, but also several trends that differed from those observed during HgA digestion (Fig. 6). When trypsin is used as the protease, continued inhibition by trypsin inhibitor and leupeptin is observed for both BSA and HgA digestion (Figs. 6a and 7a). However, for all other protease/inhibitor combinations the 24-hour digestion profile of HgA and BSA are in sharp contrast to each other. First, none of the inhibitors appear to be effective towards the proteases α-chymotrypsin, papain, and bromelain. Instead, the actual observations depend on the individual proteases used. (i) α-chymotrypsin uniquely produces a wholly mobile population, with the bars for the rigid population equaling statistical noise, indicating complete digestion of BSA, irrespective of the presence of inhibitor. (ii) For papain, the rigid population is approximately double that of the mobile population, indicating only very limited digestion of BSA, irrespective of the presence of inhibitor. (iii) Bromelain produces near-equivalence in the rigid and mobile populations. In addition, all bromelain-treated samples uniquely exhibit a strong reduction in the ΔZ metric. ΔZ values for this set of bromelain data were 3–5 Gauss below those for comparable data sets or standards, and were the lowest five values for the entire study. This change hints at a loss of molecular weight of the rigid population as will be further discussed below.
Discussion
Application of ESRSL to the determination of proteolysis and proteolysis inhibition allows for spectroscopic separation of reactant/product populations into rigid and mobile subpopulations (Fig. 1). This angular mobility-based separation provides a ready means to both track proteolysis kinetics and characterize the reactant/product mixture at any instant. The fact that whole proteins can be used as substrates ensures the bio-relevance of results. Furthermore, the extent of proteolysis can be gauged directly over any relevant period. Tracking initial formation of the mobile subpopulation, as shown in Figures 4 and 5, demonstrates qualitative agreement of the results obtained with the ESRSL method reported here with prior art. In summary, the method reported here can be used for proteolysis and proteolysis inhibition screening for many protease/substrate/inhibitor combinations using initial observations. Furthermore, continuing to track rigid and mobile subpopulations for longer time periods enables differentiation of substrates, proteases, and inhibitors.
While clearly separating the reactant/product population into rigid and mobile subpopulations, ESRSL also provides refined characterization within a given subpopulation. Upon peptide bond scission non-selective proteases such as those tested in this study can produce mobile fragments and/or leave the original substrate largely intact. ESRSL data clearly demonstrate both events, the latter expressed, for example, in variation in the rigid population metric, ΔZ (Figs. 1 and 2). This refined reactant/product characterization of subpopulations will prove crucial for more selective proteases. In summary, the ESRSL method reported here uniquely provides the ability (i) to gauge proteolytic activity on whole protein substrates, (ii) to separate reactant/product mixtures spectroscopically, and (iii) to identify and characterize multiple events and components.
The spectroscopic separation between rigid and mobile populations is the most dramatic population differentiation expressed by ESRSL. As shown in Figure 3 an increase in mobile population concentration is mirrored by a decline in rigid population concentration. This provides an internal confirmation as growth in one subpopulation reflects a decline in another. However, closer examination of the ESRSL data demonstrates population differentiation within subpopulations, as has been seen in earlier work using other methods [24, 25, 33–35]. As shown in Figure 2, the rigid subpopulation evolves continuously and rapidly with a general trend toward smaller components within the rigid subpopulation. Further, quantitative comparison of subpopulation concentrations also reflects the existence of multiple species within a subpopulation (Fig. 3). For example, a comparison of y-axis values in Figure 3a indicates a growth (e.g., to 18 μM) in the mobile subpopulation (protease only), while the corresponding rigid subpopulation declined by 45 μM (Fig. 3b). Taken collectively, ESRSL data suggest that the major subpopulations are not homogeneous, but rather are comprised of multiple, related species each with its own angular mobility and corresponding ESRSL lineshape. This seems particularly true of the rigid subpopulation in which an evolving lineshape is clearly observed, and the amplitude of the broader peaks comprised of multiple species will always be smaller than an equivalent concentration of a single species. Looking ahead, methods could be developed to improve resolution with the goal being identification of individual species within subpopulations.
The use of spin labels in ESRSL is both necessary and a potential source of concern. The method presented here relies on the use of spin label modification of a single amino acid of the 400–500 amino acids that are present in the protein substrates used in this study. Despite the minor modification, biological activity of the labeled material must be confirmed. In the current work, confirmation was achieved in three ways. First, multiple, whole protein substrates were employed, and outcomes proved comparable, particularly for early-stage kinetics (Figs. 4 and 5). Second, the results of experiments performed with cysteinyl-labeled BSA (Figs. 1, 2, 4, and 7) were identical to the results for experiments performed with the label attached to primary amines (data not shown). Third, mixed populations of labeled and unlabeled BSA or labeled and unlabeled HgA were tested against fully labeled counterparts, yet the experimental outcome for all these experiments was equivalent (data not shown).
Label considerations also enter proteolysis in another and unique way. Before the onset of proteolysis (t = 0), each and every whole-protein substrate molecule is represented in the ESRSL spectrum. Upon the onset of proteolysis, products, some without a label, become new reactants. As a result, the fraction of labeled reactants (or products) continuously declines. In other words, the other, unlabeled fraction of reactants/products is not captured in the ESRSL spectra. As our data shows, this is likely a minor issue for studies involving random or indiscriminate proteolysis. For studies involving more selective proteases or proteolytic cascades, the approach reported here will need to be refined, which is an area of current study.
Proteolysis is a multi-center, potentially complex sequence of chemical events, a process that has been linked to a wide range of diseases, as already mentioned in the Introduction. In contrast to current methods, the ESRSL-based method reported here can monitor all stages of whole protein digestion by proteases, as well as the effect of different inhibitors, without the need for physical separation or interruption of the reaction. As such the ESRSL-based method has the potential to help in the evaluation of the selectivity of drug candidates as protease inhibitors, an area of current investigation in our laboratories. Results of such ESRSL experiments will not only provide information on the nature of the interaction between the drug and the protease, but they also have the potential to provide insight in unintended consequences, for example those related to side effects and disease severity. Knowledge of both selectivity and unintended consequences of a drug candidate early on has the potential to reduce the time and money consumed in later stages of the drug development cycle.
Precisely these sorts of data are examined in the companion article [47] “Rampant Proteolysis at the Intersection of Therapy-Induced Hypoalbuminemia and Acute Pancreatitis.”
Abbreviations
BSA: Bovine serum albumin;
ESR: Electron spin resonance;
ESRSL: ESR of spin labeled materials;
HgA: Bovine hemoglobin A;
MAL6: 4-Maleimido-2,2,6,6-tetramethyl-1-piperi-dinyloxy;
PBS: Phosphate buffered saline;
SL: Spin labeled or labeling
Conflict of interest
1. All authors own stock in New Liberty Proteomics Corporation.
2. Ray Perkins is a Senior member of the editorial board for Life Sciences and Medicine at 4Open.
Acknowledgments
Financial support for this project came from the University of Illinois at Urbana/Champaign and from New Liberty Proteomics Corporation.
References
- Verhamme IM, Leonard SE, Perkins RC (2019), Proteases: Pivot points in functional proteomics. Methods Mol Biol 1871, 313–392. https://doi.org/10.1007/978-1-4939-8814-3_20. [CrossRef] [PubMed] [Google Scholar]
- Puente XS, et al. (2003), Human and mouse proteases: A comparative genomic approach. Nat Rev Genet 4, 7, 544–558. https://doi.org/10.1038/nrg1111. [CrossRef] [PubMed] [Google Scholar]
- Rawlings ND, Tolle DP, Barrett AJ (2004), MEROPS: The peptidase database. Nucleic Acids Res 32, D160–D164. https://doi.org/10.1093/nar/gkp971. [Google Scholar]
- Davie EW, Neurath H (1955), Identification of a peptide released during autocatalytic activation of trypsinogen. J Biol Chem 212, 2, 515–529. [CrossRef] [PubMed] [Google Scholar]
- Thome M, et al. (1997), Viral FLICE-inhibitory proteins (FLIPs) prevent apoptosis induced by death receptors. Nature 386, 6624, 517–521. https://doi.org/10.1038/386517a0. [CrossRef] [PubMed] [Google Scholar]
- Turk B (2006), Targeting proteases: successes, failures and future prospects. Nat Rev Drug Discovery 5, 9, 785–799. https://doi.org/10.1038/nrd2092. [CrossRef] [PubMed] [Google Scholar]
- Lopez-Otin C, Bond JS (2008), Proteases: Multifunctional enzymes in life and disease. J Biol Chem 283, 45, 30433–30437. https://doi.org/10.1074/jbc.R800035200. [CrossRef] [PubMed] [Google Scholar]
- Freije JMP, Balbín M, Pendás AM, Sánchez LM, Puente XS, López-Otín C (2003), Matrix Metalloproteinases and Tumor Progression, in: A. Llombart-Bosch, V. Felipo (Eds.), New Trends in Cancer for the 21st Century. Advances in Experimental Medicine and Biology, Vol. 532, Springer, Boston, MA. https://doi.org/10.1007/978-1-4615-0081-0_9. [Google Scholar]
- Murphy G, Nagase H (2008), Reappraising metalloproteinases in rheumatoid arthritis and osteoarthritis: destruction or repair? Nat Clin Pract Rheumatol 4, 3, 128–135. https://doi.org/10.1038/ncprheum0727. [CrossRef] [PubMed] [Google Scholar]
- Varela I, et al. (2005), Accelerated ageing in mice deficient in Zmpste24 protease is linked to p53 signalling activation. Nature 437, 7058, 564–568. https://doi.org/10.1038/nature04019. [CrossRef] [PubMed] [Google Scholar]
- Nalivaeva NN, et al. (2008), Amyloid-degrading enzymes as therapeutic targets in Alzheimer’s disease. Curr Alzheimer Res 5, 2, 212–224. https://doi.org/10.2174/156720508783954785. [CrossRef] [PubMed] [Google Scholar]
- Dollery CM, Libby P (2006), Atherosclerosis and proteinase activation. Cardiovasc Res 69, 3, 625–635. https://doi.org/10.1016/j.cardiores.2005.11.003. [CrossRef] [PubMed] [Google Scholar]
- Chou K-C, et al. (2009), Study of inhibitors against SARS coronavirus by computational approaches. Proteases Biol Dis 8 (Viral Proteases and Antiviral Protease Inhibitor Therapy), 1–23. https://doi.org/10.1007/978-90-481-2348-3_1. [Google Scholar]
- Weber IT, Zhang Y, Tozser J (2009), HIV-1 protease and AIDS therapy. Proteases Biol Dis 8 (Viral Proteases and Antiviral Protease Inhibitor Therapy), 25–45. https://doi.org/10.1007/978-90-481-2348-3_2. [Google Scholar]
- Tedbury P, Harris M (2009), Hepatitis C virus. Proteases Biol. Dis. 8 (Viral Proteases and Antiviral Protease Inhibitor Therapy), 47–69. https://doi.org/10.1007/978-90-481-2348-3_2. [Google Scholar]
- Kaspari M, Bogner E (2009), Antiviral activity of proteasome inhibitors/cytomegalovirus. Proteases Biol. Dis. 8 (Viral Proteases and Antiviral Protease Inhibitor Therapy), 71–81. https://doi.org/10.1007/978-90-481-2348-3_2. [Google Scholar]
- Nguyen J-T, Kiso Y (2009), Rational drug design of HTLV-I protease inhibitors. Proteases Biol. Dis. 8 (Viral Proteases and Antiviral Protease Inhibitor Therapy), 83–100. https://doi.org/10.1007/978-90-481-2348-3_2. [Google Scholar]
- U.S.F.a.D. Administration (2021), Coronavirus (COVID-19) Update: FDA authorizes first oral antiviral for treatment of COVID-19. https://www.fda.gov/news-events/press-announcements/coronavirus-covid-19-update-fda-authorizes-first-oral-antiviral-treatment-covid-19. [Google Scholar]
- Kaldor SW, et al. (1997), Viracept (nelfinavir mesylate, AG1343): A potent, orally bioavailable inhibitor of HIV-1 protease. J Med Chem 40, 24, 3979–3985. https://doi.org/10.1021/jm9704098. [CrossRef] [PubMed] [Google Scholar]
- Sumantha A, Larroche C, Pandey A (2006), Microbiology and industrial biotechnology of food-grade proteases: A perspective. Food Technol Biotechnol 44, 2, 211–220. [Google Scholar]
- Garcia Carreno F, Garcia C (1991), Proteases in food technology. Biotechnol Education 2, 4, 150. [Google Scholar]
- Nagodawithana T, Reed G (eds.) (1993), Enzymes in Food Processing, 3rd edn., Food Science and Technology/Academic Press, p. 480. [Google Scholar]
- Swaney DL, Wenger CD, Coon JJ (2010), Value of using multiple proteases for large-scale mass spectrometry-based proteomics. J Proteome Res 9, 3, 1323–1329. https://doi.org/10.1021/pr900863u. [CrossRef] [PubMed] [Google Scholar]
- Van de Meent MHM, De Jong GJ (2007), Improvement of the liquid-chromatographic analysis of protein tryptic digests by the use of long-capillary monolithic columns with UV and MS detection. Anal Bioanal Chem 388, 1, 195–200. https://doi.org/10.1007/s00216-007-1215-1. [CrossRef] [PubMed] [Google Scholar]
- Noda Y, et al. (1994), Specificity of trypsin digestion and conformational flexibility at different sites of unfolded lysozyme. Biopolymers 34, 2, 217–226. https://doi.org/10.1002/bip.360340208. [CrossRef] [PubMed] [Google Scholar]
- Harding VJ, Warneford FHS (1916), The ninhydrin reaction with amino acids and ammonium salts. J Biol Chem 25, 319–335. [CrossRef] [Google Scholar]
- Anson ML (1938), Estimation of pepsin, trypsin, papain and cathepsin with hemoglobin. J Gen Physiol 22, 79–89. https://doi.org/10.1085/jgp.22.1.79. [CrossRef] [PubMed] [Google Scholar]
- Bolger R, Checovich W (1994), A new protease activity assay using fluorescence polarization. Biotechniques 17, 3, 585–589. [PubMed] [Google Scholar]
- Hsu YY, et al. (2007), In vivo dynamics of enterovirus protease revealed by fluorescence resonance emission transfer (FRET) based on a novel FRET pair. Biochem Biophys Res Commun 3534, 939–945. https://doi.org/10.1016/j.bbrc.2006.12.145. [CrossRef] [PubMed] [Google Scholar]
- Hu K, et al. (2005), A human immunodeficiency virus type 1 protease biosensor assay using bioluminescence resonance energy transfer. J Virological Methods 128, 1–2, 93–103. https://doi.org/10.1016/j.jviromet.2005.04.012. [CrossRef] [Google Scholar]
- Konstantinidis AK, et al. (2007), Longer wavelength fluorescence resonance energy transfer depsipeptide substrates for Hepatitis C virus NS3 protease. Anal Biochem 368, 2, 156–167. https://doi.org/10.1016/j.ab.2007.06.020. [CrossRef] [PubMed] [Google Scholar]
- Sabariegos R, et al. (2009), Fluorescence resonance energy transfer-based assay for characterization of Hepatitis C Virus NS3-4A protease activity in live cells. Antimicrob Agents Chemother 53, 2, 728–734. https://doi.org/10.1128/AAC.01029-08. [CrossRef] [PubMed] [Google Scholar]
- Overall CM, et al. (2004), Protease degradomics: mass spectrometry discovery of protease substrates and the CLIP-CHIP, a dedicated DNA microarray of all human proteases and inhibitors. Biologic Chem 385, 6, 493–504. https://doi.org/10.1515/BC.2004.058. [Google Scholar]
- Tam EM, et al. (2004), Membrane protease proteomics: Isotope-coded affinity tag MS identification of undescribed MT1-matrix metalloproteinase substrates. Proc Natl Acad Sci USA 101, 18, 6917–6922. https://doi.org/10.1073/pnas.0305862101. [CrossRef] [PubMed] [Google Scholar]
- Gruninger-Leitch F, et al. (2000), Identification of beta-secretase-like activity using a mass spectrometry-based assay system. Nature Biotechnol 18, 1, 66–70. https://doi.org/10.1038/71944. [CrossRef] [PubMed] [Google Scholar]
- Raorane DA, et al. (2008), Quantitative and label-free technique for measuring protease activity and inhibition using a microfluidic cantilever array. Nano Lett 8, 9, 2968–2974. https://doi.org/10.1021/nl8019455. [CrossRef] [PubMed] [Google Scholar]
- Ogawa S, McConnel HM (1967), Spin-label study of hemoglobin conformations in solution. Proc Natl Acad Sci USA 58, 1, 19–26. https://doi.org/10.1073/pnas.58.1.19. [CrossRef] [PubMed] [Google Scholar]
- Barnes JP, et al. (1999), A multifrequency electron spin resonance study of T4 lysozyme dynamics. Biophys J 76, 6, 3298–3306. https://doi.org/10.1016/S0006-3495(99)77482-5. [CrossRef] [PubMed] [Google Scholar]
- Perkins RC, et al. (1982), Equilibrium binding of spin-labeled fatty-acids to bovine serum-albumin – suitability as surrogate ligands for natural fatty-acids. Biochemistry 21, 17, 4059–4064. https://doi.org/10.1021/bi00260a023. [CrossRef] [PubMed] [Google Scholar]
- Wenzel HR, et al. (1981), Spin-label studies on protein proteinase-inhibitors – complex-formation and conformational-changes of the bovine trypsin-inhibitor (Kunitz). Biophys Struct Mech 7, 4, 285. https://doi.org/10.1007/BF02425416. [CrossRef] [Google Scholar]
- Berliner LJ (1976), Spin Labeling Theory and Applications, Molecular Biology Series, Vol. 1, Academic, New York, NY. [Google Scholar]
- Morriset JD, Broomfield CA (1972), Comparative study of spin-labeled serine enzymes – acetylcholinesterase, trypsin, alpha-chymotrypsin, elastase, and subtilisin. J Biological Chem 247, 22, 7224–7231. [CrossRef] [Google Scholar]
- Bartosz G, Gaczynska M (1985), Effect of proteolysis on the electron spin resonance spectra of maleimide spin labeled erythrocyte membrane. Biochim Biophys Acta 821, 2, 175–178. https://doi.org/10.1016/0005-2736(85)90086-0. [CrossRef] [PubMed] [Google Scholar]
- Kear JL, et al. (2011), Monitoring the autoproteolysis of HIV-1 protease by site-directed spin-labeling and electron paramagnetic resonance spectroscopy. J Biophys Chem 02, 02, 137–146. https://doi.org/10.4236/jbpc.2011.22017. [CrossRef] [Google Scholar]
- Frattali VP, Steiner RF, (1968), Soybean Inhibitors I. Separation and some properties of 3 inhibitors from commercial crude soybean trypsin inhibitor. Biochemistry 7, 2, 521–530. https://doi.org/10.1021/bi00842a006. [CrossRef] [PubMed] [Google Scholar]
- Umezawa H (1976), Structures and activities of protease inhibitors of microbial origin. Methods Enzymol. 45 (Proteolytic Enzymes, Pt. B), 678–695. https://doi.org/10.1016/s0076-6879(76)45058-9. [CrossRef] [Google Scholar]
- Leonard SEP, Kenis PJA, Perkins RC (2022), Rampant proteolysis at the intersection of therapy-induced hypoalbuminemia and acute pancreatitis. 4open 5, 14. [CrossRef] [EDP Sciences] [Google Scholar]
Cite this article as: Leonard S-E, Kenis PJA & Perkins RC 2022. Realtime, continuous assessment of complex-mixture protease and protease inhibitor activity. 4open, 5, 11.
All Figures
|
Figure 1 ESRSL spectra of a 64 kDa protein (BSA) spin-labeled at a “mobile” site (green line) or at a rigid site (blue line). The third, “composite” ESRSL “spectrum” (black line) is obtained by summation of the mobile and rigid spectra. This composite spectrum is typical for the case where both rigid and mobile populations are present. Key areas of the composite spectrum reflect only the contributions of either the rigid or mobile population, so they can be quantified independently: the height of the low-field (left most) ESRSL peak varies in proportion to the rigid population, and the height of the sharp, high-field peak varies in proportion to the mobile population. Furthermore, the parameter ΔZ is a qualitative metric for the nature of the rigid population. |
| In the text | |
|
Figure 2 (a) ESRSL spectra of MAL6-labeled BSA (0 min, black) as well as 7, 24, and 41 min after addition of trypsin (green, blue, and red curves). Note the changes in the spectral features: the increase in the intensity of the three main peaks (mobile population), the decrease in the intensity of the leftmost peak (rigid population) and the shift in the position of some of the peaks on the right (reduction in ΔZ, see inset) indicating a decrease in molecular weight of the rigid population. (b) ESRSL spectra for the same experiment as part (a), but now in the presence of a trypsin inhibitor. |
| In the text | |
|
Figure 3 Increase in mobile population and near-symmetric decline in rigid population over a 41-minute time course. Data shown is that for digestion of HgA by α-chymotrypsin, alone or in the presence of three known protease inhibitors. Error bars for mobile population are too small to be visible at this scale. |
| In the text | |
|
Figure 4 Increase in mobile population over a 41-minute time course for digestion of BSA by four proteases: Trypsin, α-chymotrypsin, papain, and bromelain. Each protease acted alone or in the presence of three known protease inhibitors. Error bars are too small to be seen at this scale. |
| In the text | |
|
Figure 5 Increase in mobile population over a 41-minute time course for digestion of HgA by four proteases: Trypsin, α-chymotrypsin, papain, and bromelain. Each protease acted alone or in the presence of three protease inhibitors. Error bars are too small to be seen at this scale. |
| In the text | |
|
Figure 6 Rigid and mobile population concentrations following a 24-hour, room-temperature digestion of HgA by four proteases: Trypsin, α-chymotrypsin, papain, and bromelain. Each protease acted alone or in the presence of three known protease inhibitors. Total substrate concentration was 100 μM. |
| In the text | |
|
Figure 7 Rigid and mobile population concentrations following a 24-hour, room-temperature digestion of BSA by four proteases: Trypsin, α-chymotrypsin, papain, and bromelain. Each protease acted alone or in the presence of three known protease inhibitors. Total substrate concentration was 160 μM. |
| In the text | |