Open Access
Figure 2
Download original image
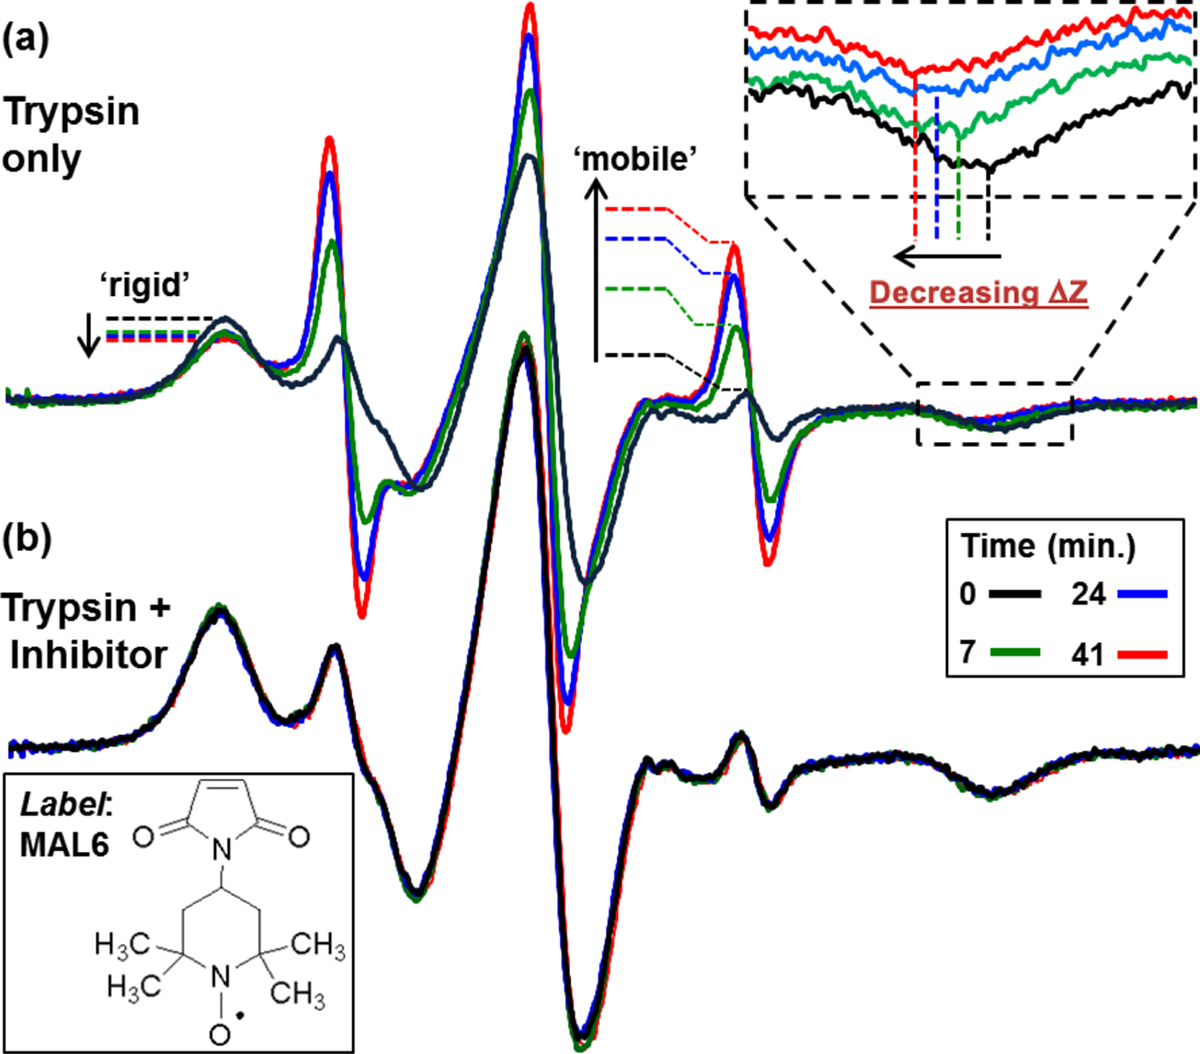
(a) ESRSL spectra of MAL6-labeled BSA (0 min, black) as well as 7, 24, and 41 min after addition of trypsin (green, blue, and red curves). Note the changes in the spectral features: the increase in the intensity of the three main peaks (mobile population), the decrease in the intensity of the leftmost peak (rigid population) and the shift in the position of some of the peaks on the right (reduction in ΔZ, see inset) indicating a decrease in molecular weight of the rigid population. (b) ESRSL spectra for the same experiment as part (a), but now in the presence of a trypsin inhibitor.