Figure 2
Download original image
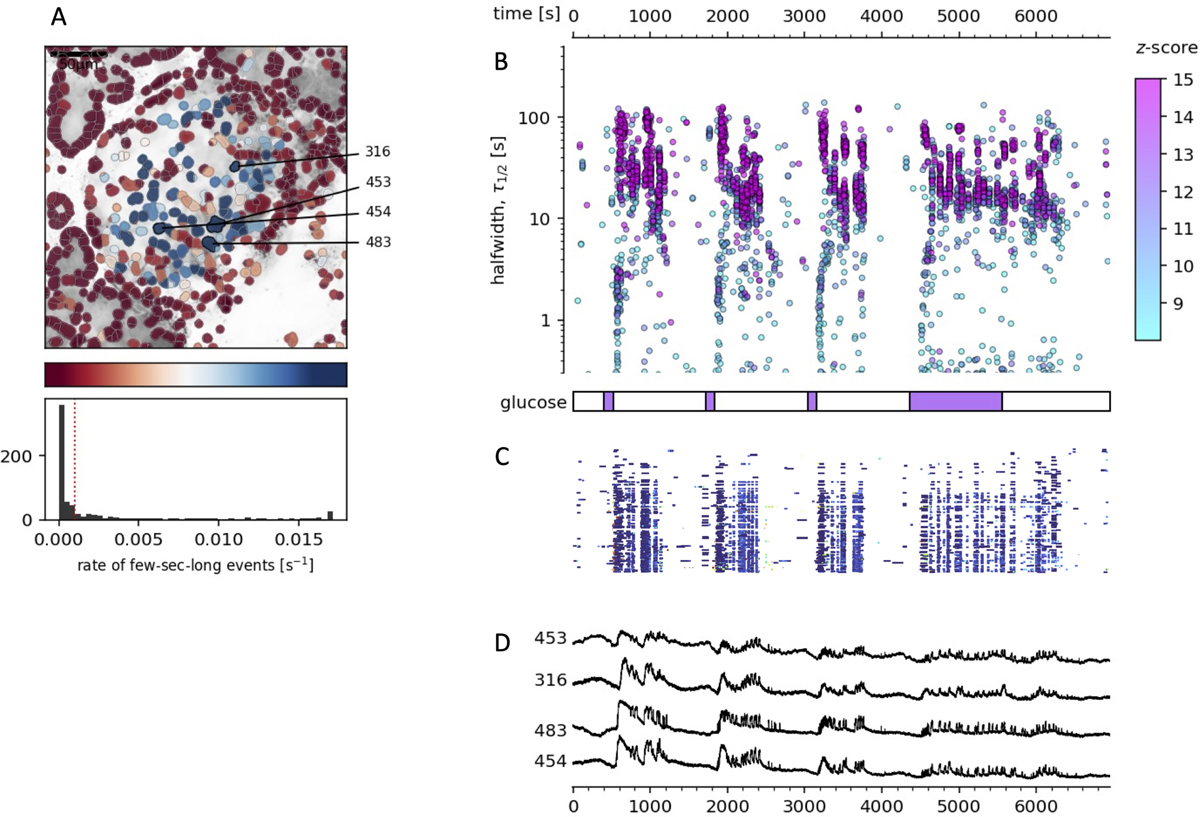
Response adaptivity and memory. (A) Regions of interest (ROIs) obtained by our segmentation algorithm [23]. The color indicates the number of events identified in the ROI trace, upon a high-pass filtering at 0.2 Hz. We discarded ROIs with number of events below the threshold (red dashed line in the histogram in the lower panel). Indicated are the ROI numbers whose filtered traces correlate best with the average trace for the whole islet. The most active cells indicated with blue tones present beta-cell in the core of the islet. (B) Events’ halfwidth duration through time for an islet exposed to a quadruple 16 mM glucose stimulation protocol (purple areas of the protocol bar at the bottom of the pane) with resting periods in 6 mM glucose (white protocol areas). Only events with z-score above 8 are presented. (C), A raster plot of [Ca2+]c events showing activity events in individual ROIs. (D), Time courses from ROIs indicated in A, and rebinned to 2 Hz (recorded at 20 Hz). The abscissa is shared for plot B–D.