| Issue |
4open
Volume 1, 2018
|
|
|---|---|---|
| Article Number | 4 | |
| Number of page(s) | 15 | |
| Section | Life Sciences - Medicine | |
| DOI | https://doi.org/10.1051/fopen/2018004 | |
| Published online | 22 August 2018 | |
Research Article
Visual gene network analysis of aging-specific gene co-expression in human indicates overlaps with immuno-pathological regulations
1
Post-Graduate Department of Biosciences and Biotechnology, School of Biotechnology, Fakir Mohan University,
Balasore
756020,
Odisha,
India
2
Department of Internal Medicine, Section on Molecular Medicine, Wake Forest School of Medicine, Medical Center Boulevard,
Winston-Salem
27157,
NC, USA
3
Central University of Jharkhand, Brambe,
Ratu-Lohardaga Road,
Ranchi
835205,
Jharkhand, India
4
Khallikote University,
Berhampur
760001,
Odisha, India
* e-mail: This email address is being protected from spambots. You need JavaScript enabled to view it.
Received:
19
September
2017
Accepted:
4
July
2018
Abstract
Introduction: Aging is a complex biological process that brings about a gradual decline of physiological and metabolic machineries as a result of maturity. Also, aging is irreversible and leads ultimately to death in biological organisms.
Methods: We intend to characterize aging at the gene expression level using publicly available human gene expression arrays obtained from gene expression omnibus (GEO) and ArrayExpress. Candidate genes were identified by rigorous screening using filtered data sets, i.e., GSE11882, GSE47881, and GSE32719. Using Aroma and Limma packages, we selected the top 200 genes showing up and down regulation (p < 0.05 and fold change >2.5) out of which 185 were chosen for further comparative analysis.
Results: This investigation enabled identification of candidate genes involved in aging that are associated with several signaling cascades demonstrating strong correlation with ATP binding and protease functions.
Conclusion: A majority of these gene encoded proteins function extracellularly, and also provide insights into the immunopathological basis of aging.
Key words: Aging / Human / Microarray analysis / Gene expression / Gene networks / Skin / Brain / Mitochondria
© B.P. Parida et al., Published by EDP Sciences 2018
 This is an Open Access article distributed under the terms of the Creative Commons Attribution License (http://creativecommons.org/licenses/by/4.0/), which permits unrestricted use, distribution, and reproduction in any medium, provided the original work is properly cited.
Introduction
Aging is a complex biological process (BP) that is incremental with the passage of time. It is a time-dependent, non-reversible, and sequential deterioration of a mature organism. The process decreases an organism's ability to cope with environmental stress and increases the probability of death. Further, it involves exponential increase in mortality rate, broad range of physiological changes and increased susceptibility to disease that ultimately leads to death [1]. Thus, aging is defined as an association of structural and functional decline over the course of time [2]. These functional changes may also be susceptive for a number of diseases with the passage of time [3]. The result of complex interaction of environmental, genetic, epigenetic and environmental factors have an impact on survival [4]. Out of 300+ aging theories, a few notable ones are based on genetics, immune, telomere, mitochondria, and free radicals [5]. To date, several hundred genes have been associated with aging.
To identify the causes of both cellular and tissue aging is challenging. Cellular imbalance due to DNA damage is affected by alteration in global gene expression profiles [6]. Gradual loss of normal structure and function of myofibers and neurons with passage of time is chronological aging. Further, mutations in DNA and telomere shortening during cell division, may lead to replicative aging in skin and stomach [7]. During the lifespan of an individual, divisions of adult stem cells occur which are a part of the replicative and chronological aging process [8]. As the number of mutations increase with age, so does the likelihood that a cell will undergo abnormal apoptosis and proliferation, premature senescence, and will become cancerous [9]. Currently, however, the role of transcriptional regulation of gene expression in aging is unknown.
Over several decades, aging in humans has been studied using gene expression microarrays to gather insights into the biology of aging [10]. Primary microarray data archived in the public repositories and availability of improved statistical methods provide an opportunity for prediction of aging and its mechanisms [11]. Clustering analysis has been performed to provide insights on genes having similar patterns of expression by using differential gene expression methods. Mostly, kyoto encyclopedia of genes and genomes (KEGG) [12], WEB-based Gene SeT AnaLysis Toolkit (WebGESTALT) [13] and several others databases are used for pathway enrichment analysis and to provide insights into BPs. Such resources are useful for biologists who need to analyze and interpret the complex microarray data. Molecular signatures can be identified by enhancing the signal-to-noise ratio, by comparing expression profiles across platforms, and by eliminating biases of individual species [14]. Microarray meta-analysis refers to gathering large amounts of data from multiple sources such as published articles, and pooling them to solve research problems. Meta-analysis of gene expression allows integration of multiple microarray studies and helps to determine a conserved genetic signature [15].
Microarray and meta-analysis studies in humans have been conducted by comparing various samples across an individual's lifespan [16] or by comparing old and young tissues [17]. These studies help us to understand the complex process of aging and, importantly, allow identification genes that are biomarkers of aging. For instance, the gene expression database of aging, Gene Aging Nexus (GAN), stores a huge volume of gene expression data form aging studies [18]. During aging gene dataset analysis, differential gene expression of some genes occurs and there are few shared genes across different tissues [19] and species [20]. The critical challenge is to identify how these genes are related to pathological, biochemical, and physiological changes associated with age. These advanced methods would allow researchers to pursue primary functional genomic data analysis derived from human tissues without sacrificing much time, resources, and administrative efforts in the generation of results for finding therapeutic targets and biomarkers of interest for a given disease.
We used a meta-analysis approach by pooling data from public microarray data archives, including the NCBI GEO [21] and ArrayExpress [22], and this allowed us a free access to experimentally obtained data. Herein, we developed a simple workflow to compare age-related differential gene expression data from humans using R package and Limma algorithm. The objective of this study was to identify a set of candidate genes involved in aging and its progression by a microarray meta-analysis approach. We interpret our results in the context of established physiological and biochemical pathways that show age-related alterations.
Materials and methods
Data selection and preprocessing
The NCBI GEO and the ArrayExpress microarray databases were used to search for gene expression datasets by using several keywords (and combinations thereof) “age and brain”, “age and skin”, “age and mitochondria” “age and energy”, “age and development”, and “age and muscle”. We focused on humans only, and the datasets for meta-analysis were retrieved from the NCBI GEO DB. We followed an approach for data selection to study the selected data for this meta-analysis and several R-packages to reduce differences among them. PubMed literature database was used and Affymetrix raw data files (.CEL files) were directly downloaded from the GEO DB. We downloaded the gene expression data set's .CEL files: GSE11882 [23], GSE47881 [24] and GSE 32719 [25], which were all acquired using the GPL570 [HG-U133_Plus_2] Affymetrix Human Genome U133 plus 2.0 array platform and were published from 2008 to 2013. We carefully examined the datasets and followed data selection guidelines as summarized (Fig. 1). Three individual studies having a total of 245 arrays (.CEL files) in normal conditions were selected for further analysis. The data were classified as belonging to young (<30 yrs) and aged (>30 yrs) human beings. There are known earlier studies where such categorization of age groups have been performed, i.e., >40 yrs. and <40 yrs. [26], >20 yrs. and <20 yrs [16,27,28] as arbitrary cut-off points to average the biological changes as pre- and post-natal developmental age to labeling the groups as early and middle adulthood. All 245 arrays were first assessed by the Aroma package (Supplementary Information) [29] for background correction. Data quality was assessed using simpleaffy and affyPLM packages in Bioconductor following standard procedures in R and Aroma to determine normalized unscaled standard errors (NUSE) and relative log expression (RLE) plots [30] (Fig. 2A and B). Aroma quantile normalization plot (Fig. 2C) and also using SPIA package we deduced pathways linked to aging (Fig. 2D).
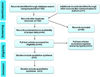 |
Fig. 1 Data selection process. |
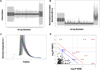 |
Fig. 2 (A) Box plots of 245 arrays of RLE; (B) Box Plots of 245 arrays of NUSE; (C) Aroma.affymetrix QN data; (D) SPIA two-way evidence plot. Each pathway is represented by one dot. The pathways at the right of the red oblique line are significant. |
Screening of differentially expressed genes
The selected datasets helped us to assess combined gene expression changes related to aging. All control experimental array files (245 .CEL files) selected for analysis indicated that 55 were of young age (<30 yrs of age) and 190 were from old age (>30 yrs of age) human datasets. All these data sets were processed through quality control (QC) assessment (Fig. 2A and B). We used the Limma package to identify the differentially expressed gene profiles by assigning sample age groups [31]. False discovery rates (FDR) [32] were used for corrections during multiple comparisons (Supplementary Information).
We combined preprocessed data separately for each category using a direct data integration process. For the differential expression analysis, we grouped data as young (<30 yrs) and aged (>30 yrs) categories. By combining significantly and differentially expressed genes, we annotated and summarized the functionality of these genes. Multiple probe-sets issues, multiple testing corrections, and duplicate genes were removed using Aroma. The identification of the top 200 differentially expressed genes was done using Limma package (Supplementary Tab. S1). Finally, all 185 protein-coding genes were retained and 15 uncharacterized genes, i.e., annotated as unknown, were manually removed from the list.
Annotation of differentially expressed genes
All characterized genes were carefully studied and additional components like the Enzyme Commission (EC) number [33], Universal Protein resource (UniProt) IDs [34], and physical properties of gene-encoded proteins, cellular localization, protein domain, protein family, and protein superfamily information were obtained. Using NCBI, all corresponding protein sequences were downloaded while protein localization, Gene Ontology (GO), and annotation types were derived using Loctree3 [35] (Supplementary Tab. S2).
Visual gene network construction and expansion
We divided these 185 genes into two groups as enzyme and non-enzyme encoding genes. To obtain the protein-protein interaction (PPI) networks of differentially expressed enzymatic and non enzymatic gene-encoded proteins, we constructed a PPI network of aging using the functionalities of Cytoscape version 2.8.0 [36], through BisoGenet version 1.41 plugin, and used the identified proteins and genes as bait nodes and added further edges. Using label nodes as bait proteins, we expanded the network and included some unlabeled nodes/proteins as a part of network expansion. We performed a theoretical interactome analysis for all 152 non-enzymatic and 33 enzymatic proteins. We discovered that the hub genes had a maximum interacting partner both for enzymatic and non-enzymatic genes. To find out conserved domains, we performed analysis for these genes using NCBI's batch CDD analysis for all proteins while the localization of these proteins were inferred using Loctree3 [35].
GO Enrichment analysis
Using functional annotation cluster analysis on the list of differentially expressed gene-encoded proteins using DAVID [37], the GO analysis for BP, cellular component (CC), and molecular function (MF) was employed to categorize the enriched biological themes for the list [38]. We decided to use standard false discovery rate (FDR) cut-off values for data analysis [39,40]. Only GO terms that contained more than four genes with a FDR value <0.02 cut-off were chosen for non-enzymatic gene analysis (Fig. 3A, Supplementary Tab. S3). Similar functional analysis was done for the enzyme coding genes using DAVID's default parameters (Supplementary Tab. S4). For GO term enrichment, only those with more than two genes with a FDR value <0.02 cut off were chosen for analysis (Supplementary Tab. S5).
Functional enrichment analyses of all 185 genes were also performed using ToppFun available in the ToppGene suite [41]. Over-representation of genes were submitted and analyzed as GO categories (CC, MF, BP), gene family, and having a particular protein domain (Pfam, PSSM, CD etc.) (Supplementary Tab. S6). We used categories comprising greater than 3 and fewer than 1500 genes for greater sensitivity (p-value < 0.05).
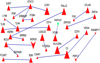 |
Fig. 3 Non Enzymatic proteins having interaction. Green and v shaped shows down-regulated and tringle and red shaped elements are up-regulated and their respective sizes are reflection of adjusted P-values. |
Enrichment analysis of KEGG biological pathways
To gain critical biological insights into the pathway-level regulation of aging, we used Limma and DAVID to perform KEGG pathway cluster analysis of the differentially expressed genes. To determine changes in pathways related to aging, we only chose pathway terms that contained more than two genes for all 185 differentially expressed genes for both non-enzymatic and enzymatic protein coding genes (Supplementary Tab. S7). Similarly, KEGG pathway inferences from DAVID analysis were obtained for non-enzymatic genes (Supplementary Tab. S8). Furthermore, we associated the top 20 pathways derived by using R-based Bioconductor SPIA package (Supplementary Tab. S9).
Results
Data selection, preprocessing, and integration and Aroma analysis
Microarray data repositories are publicly available and an extensive search of these repositories revealed that there is a large number of datasets available involving human aging and from several human organs. Goals of these studies were diverse and included different test conditions, tissue types, and subjects. Analysis of statistical and functional annotation of microarray data can be done using several methods [42]. The data sets used in this study were obtained from public microarray data repositories, i.e., NCBI GEO and ArrayExpress where microarray data are available and associated with aging. A detailed review of the resulting literature articles revealed that the studies included various age-specific samples. After careful examination of these datasets and following suitable data selection guidelines (Fig. 1), we identified 3 individual studies consisting of a total of 245 arrays. However, we could not affirm if the data sets belonged to any specific gender, i.e., male or females. Following quality assessment, we used the Aroma package (Supplementary Information) and the quantile normalization (QN) data as shown (Fig. 2A–C). We used signaling pathway impact analysis (SPIA) package, which uses the information from a list of differentially expressed genes and identify the pathways most relevant to a condition under the study. Using this SPIA package we obtained a set of 245 resultant pathways (Fig. 2D) and we also obtained the top 20 associated pathways [43] (Supplementary Tab. S9).
Screening of differentially expressed genes
We obtained 200 differentially expressed genes (log FC>2.5 and P < 0.05 as cut-offs) between the young and aging data sets (Supplementary Tab. S1). A post-manual curation was performed to eliminate unknown/ hypothetical and uncharacterized genes and we obtained a final list of 185 characterized genes that included 33 gene-encoded enzymatic proteins and 13 transcription factors involved in the aging process. Based on the fold change cut-off, we identified a total of 122 genes that were up regulated and 63 genes were down regulated. Out of 122 genes up-regulated, 20 were encoded enzymes whereas out of those 63 genes down regulated, 14 included enzymatic proteins (Supplementary Tab. S2). The most enriched EC numbers in the aging process were those of kinases like mitogen-activated protein kinase kinase kinase 3 (MAP3K3), G protein-coupled receptor kinase 6 (GRK6), and nima (never in mitosis gene a)-related kinase 2, NIMA2 (NEK2), ATPases like RuvB-like 2 (E. coli) (RUVBL2), and ligases like E3 ubiquitin-protein ligase ZNRF1 (ZNRF1) and myosin regulatory light chain interacting protein (MYLIP).
Protein-protein interaction (PPI) network reconstruction
A theoretical interactome analysis was performed to add the experimentally suggestive interactions among the 185 identified proteins using BisoGenet version 1.41. This plugin employs its own SysBiomics DB along with integration of other information from several other public databases like UniProt, Ensembl, Kyoto Encyclopedia of Genes and Genomes (KEGG), and etc. The connections between proteins represented experimentally verified PPIs among 75 out of the 185 proteins identified in this study. This current network shows 185 nodes with 83 edges. The proteins that did not interact in this network did not have experimentally proven direct interaction, and hence, we extended the network by adding a neighboring node up to one distance of an individual protein.
Network extension of gene-encoded proteins
We expanded the network by including all 185 identified proteins as bait which resulted in a network of 2127 nodes and 3305 edges. Similarly, the expansion of the network by including all identified non-enzymatic 152 proteins as bait resulted in a network of 1730 nodes and 2419 edges. The presented views of the networks obtained from the extended network indicate the top 10 bait proteins identified as showing the most interactions (Fig. 3, Supplementary Tab. S10). We found that out of 152 proteins, 137 proteins interacted at least one with another interacting protein. The interaction range of these proteins ranged from 1 to 193. Out of these 137 proteins, the top most interacting molecules are signal transducer and activator of transcription 3 (STAT3), serine/arginine repetitive matrix protein 2 (SRRM2), B-cell lymphoma 6 protein (BCL6), heat shock protein beta-1 (HSPB1), heat shock protein 27 (Hsp27), src substrate cortactin (CTTN), first apoptosis signal receptor (FasR), progesterone receptor (PGR), zinc-finger protein 24 (ZNF24), and caspase-8 (CASP8) and Fas-associated protein with death domain (FADD)-like apoptosis regulator (CFLAR). Most of these proteins were of nuclear origin and included few nuclear transcription factors like STAT3, BCL6, and ZNF24.
The maximum number of interacting partners of our top 10 gene-encoded proteins ranged from 55 to 193. Surprisingly, all these 10 proteins are up regulated and most of them are nuclear-located. From this list we obtained three transcription factors involved in the aging process that showed maximum interactions. These transcription factors belong to the classes of immunoglobulin fold like STAT3, zinc-coordinating DNA-binding domains like ZNF24, and C2H2 Zinc finger factors like BCL6. Other important interacting top cytoplasmic proteins are HSPB1, CTTN, and CFLAR, and nuclear proteins such as SRRM2 and PGR.
Using a similar approach used for enzyme-coding genes, we performed theoretical interactome for all 33 genes and extended the network to include more interacting elements (Supplementary Tab. S11). We were able to find 10 principal interacting enzymes (Tab. 1) out of which MAP3K3, transglutaminase 2 (TGM2), and FK506 binding protein 5 (FKBP5) were up regulated and RUVBL2, histone deacytelase 9 (HDAC9), NEK2, OTU deubiquitinase, ubiquitin aldehyde binding 2 (OTUB2), GRK6, ZNRF1, and MYLIP were down regulated during aging (Supplementary Tab. S11).
Top 10 enzymes involved in aging having maximum interactions.
Protein-level annotations and GO function analysis
Functional analysis of the protein super families of enzymatic and non-enzymatic proteins (E-value cutoff of 0.01) was obtained using the NCBI CDD search tool [44] after grouping them as either enzymatic or non-enzymatic (Supplementary Tab. S12). Results indicate that the enriched domains mostly belonged to cl00043, smart00032, cd00033, and pfam00084 (all the domains are a member of complement control protein (CCP) modules that contain approximately 60 amino acid residues and have been identified in several proteins of the complement system) (Supplementary Tab. S13). For the non-enzymatic proteins, the enriched conserved domains belonged to pfam13855 (a member of Leucine rich repeat superfamily), cl19539 and pfam13465 (are member of Zinc-finger double domain superfamily), TIGR02169 and COG1196 (are members of structural maintenance of chromosomes) superfamily proteins have ATP-binding domains at the N- and C-termini, and two extended coiled-coil domains separated by a hinge in the middle) (Supplementary Tab. S14).
The DAVID functional annotation clustering tool grouped genes based on their associated GO annotations. Functional analysis of the 33 differentially expressed enzymatic genes associated with aging enrichment generated nine clusters using the default parameters (Tab. 2). Among those clusters, the most over-represented functions were associated with ATP binding (enrichment score of 2.66), and other immune-related BPs (Supplementary Tab. S15). Functional analysis of the 152 differentially expressed non-enzymatic genes associated with aging generated a total of 60 clusters (Supplementary Tab. S16). Among these clusters, the most over-represented GO terms were associated with immune response (GO: 0006955) (enrichment score of 6.79) (Fig. 4B).
Functional analysis of the 185 differentially expressed genes using DAVID analysis generated 75 clusters (Fig. 4A) of which the most over-represented GO terms are associated with mostly immune related BPs having enrichment score of 5.0 (Supplementary Tab. S5). The Toppgene functionality allowed enrichment of a given gene list based on ontologies, pathways, phenotypes, drug-gene associations, and indicated that out of the 152 genes, the most BPs from the GO analysis were clustered into (Supplementary Tab. S17): (a) defense response for Fc fragment of IgE receptor Ig (FCER1G), serpin family A member 3 (SERPINA3), beta-2-microglobulin (B2M), defensing beta 119 (DEFB119), lymphocyte antigen 96 (LY96), prostaglandin E receptor 3 (PTGER3), interleukin 6 signal transducer (IL6ST), toll like receptor 5 (TLR5), toll like receptor 4 (TLR4), Fc fragment of IgG receptor IIa (FCGR2A) etc. (p = 1.25 × 10⁻⁸); (b) immune response for FCER1G, B2M, alpha-2-glyoprotein 1, zinc binding (AZGP1), LY96, IL6ST, TLR5, Fc fragment of IgG receptor and transporter (FCGRT), TLR4, Fc fragment of IgG receptor IIIb (FCGR3B), FCGR2A, CD200 receptor 1 (CD200R1), triggering receptor expressed on myeloid cells 2 (TREM2), interleukin 18 binding protein (IL18BP) (p = 7.97 × 10⁻⁹); (c) response to wounding for FCER1G, endothelin 1 (EDN1), SERPINA3, angiopoietin 2 (ANGPT2), LY96, PTGER3, IL6ST, TLR5, MPL proto-oncogene thrombopoietin receptor (MPL), TLR4, myoferlin (MYOF), FCGR2A etc. (p = 4.76 × 10⁻¹); (d) signaling receptor activity for EGF containing fibulin extracellular matrix protein 1 (EFEMP1), FCER1G, PGR, LY96, PTGER3, IL6ST, TLR5, FCGRT, TNF receptor superfamily member 18 (TNFRSF18), MPL, TLR4, FCGR2A, TREM2, C-type lectin domain containing 7A (CLEC7A), etc. (p = 3.75 × 10⁻⁶) among others. Similarly, Toppgene analysis of the 33 enzymatic proteins detected most functions like ATP binding for NEK2, bone morphogenic protein (BMP) inducible kinase 2 (BMP2K), Rho related BTB domain containing 3 (RHOBTB3), MAP3K3, GRK6, RUVBL2, katanin catalytic subunit A1 like (KATNAL1), pseudopodium enriched atypical kinase 1 (PEAK1), acyl-CoA synthetase short chain family member 3 (ACSS3), glutaminyl-tRNA synthase (glutamine-hydrolyzing)-like 1 (QRSL1), and ADCY7 (p = 0.00003498). Other functions contained ligase activity for MYLIP, membrane associated ring-CH-type finger 6 (MARCH6), ACSS3, QRSL1, and ZNRF1 (p = 0.002061), peptidase activity, acting on L-amino acid peptides for complement factor b (CFB), complement component 1s (C1S), complement factor I (CFI), TraB domain containing 2A (TRABD2A), and OTU deubiquitinase, ubiquitin aldehyde binding 2 (OTUB2) (p = 0.003674), and protein kinase activity for NEK2, BMP2K, MAP3K3, GRK6, and PEAK1 (p = 0.004241) (Tab. 3) (Supplementary Tab. S18). We have summarizes all the tools and approaches for the bioinformatics analysis (Supplementary Fig. 1).
Top enrichment cluster displaying high enrichment score from David analysis for enzymes (Annotation Cluster 1, enrichment Score: 2.66).
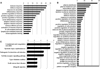 |
Fig. 4 (A) GO analysis of all 185 genes derived from DAVID analysis having minimum Six genes and Fdr < 0.02; (B) GO analysis of the non-enzyme coding genes derived from DAVID Functional Analysis Chart minimum of four genes and Fdr cut off 0.02; (C) KEGG pathway all 185 genes derived from DAVID analysis having Minimum two genes. |
Top five GO terms having maximum number enzymes in query list of Topp gene analysis.
Enrichment analysis of metabolic pathways
The enrichment analysis of metabolic pathways was performed using DAVID to conduct KEGG pathway analysis of the 185 genes in the PPI network and to choose metabolic pathways with P < 0.05 (Supplementary Tab. S7). Results indicated that the gene-encoded proteins are involved in complement and coagulation cascades for proteins such as complement component 3 (C3), complement c1q b chain (C1QB), C1S, complement c3a receptor 1(C3AR1), CFI, CFB, von Willebrand factor (VWF) (KEGG Pathway ID: hsa04610), and Toll-like receptor (TLR) signaling pathways (CD14, TLR4, TLR5, cluster of differentiation 86 (CD86), LY96) (KEGG Pathway ID: hsa04620) implying their roles in inflammatory processes. The KEGG pathway analysis of the 152 genes in the protein interaction network, and chosen metabolic pathways with P < 0.05, revealed that the metabolic pathway-related genes were involved in cytokine-cytokine receptor interaction (KEGG Pathway ID: hsa04060), pathogenic Escherichia coli infection (KEGG Pathway ID: map05130), and TLR signaling pathways (KEGG Pathway ID: hsa04620) (Fig. 4C) (Supplementary Tab. S8). A few of the top pathways like the Staphylococcus aureus infection, Systemic lupus erythematosus, complement and coagulation cascades, mineral absorption, pertussis, the Salmonella infection, regulation of actin cytoskeleton, Tuberculosis, and Toll-like receptor signaling pathways were the top candidates in aging-related gene network analysis (Supplementary Tab. S9).
Discussion
Clustering of diverse aging related pathways
Aging is a complex process that is associated with cumulative changes in plethora of genes, and thus it is important to identify these interrelated pathways of aging. Bioinformatic analysis of a set of age-regulated genes can reveal a lot of interesting insights into the aging process [45]. DAVID analysis of 185 genes involved in aging generated 75 clusters, of which the most over-represented GO terms were associated with extracellular region proteins ribonuclease RNase A family (RNASE4), AZGP1, SERPINA3, ribonuclease RNase A family k6 (RNASE6), CFI and immune related BPs consistent with aging [46]. The topmost interacting proteins like BCL6, CTTN, FSL, PGR, ZNF24, are known to be involved in the aging process. For instance, the BCL6 gene is involved in the aging process as it negatively regulates senescence by conferring resistance to the protein 19 (p19) alternate reading frame (p19ARF)-protein 53 (p53) anti-proliferative pathway [47]. Transcription factors like ZNF24 represses vascular endothelial growth factor (VEGF) transcription and acts as a negative regulator of tumor growth by inhibiting angiogenesis; similarly, it has been found to be involved in the aging process as angiogenesis in healthy older mice and is slower than in young mice [48]. It has also been found that PGR expression increases in aging rats [49].
Additionally, we observed 47 cytoskeletal proteins involved in the aging process (Supplementary Tab. S1). Cytoskeletal molecules such as HSPB1 and actin form a complex. Further, HSPB1 plays a role in cell motility and is important for cytoskeletal alteration during aging. Furthermore, CTTN plays an important role in clustering of intercellular adhesion molecule 1 (ICAM1) and F-actin during polymorphonuclear cell transmigration [50]. As alterations in the actin cytoskeletal network occur in cells of aging eukaryotic individuals, we suggest that our gene of interest HSPB1 and CTTN play a role in aging process, as corroborated elsewhere [51]. Expression of Fas, FasR and Fas ligand (FasL) are higher in the spleen of older animals and plays an important role in lipopolysaccharide-induced accelerated apoptosis and hyper-inflammation in older rats. Overexpression of murine CFLAR in undifferentiated muscle cells interferes with homeostasis in skeletal muscle and may play a role in skeletal muscle premature aging [52,53]. Similarly, increased expression of c-Flip affects satellite cell proliferation and induces skeletal muscle aging. FKBP5 expression is up regulated and this is consistent with the age-dependent increase in FK506 binding protein 51 (FKBP51) expressions that was previously reported in mice [54]. We conclude that cytoskeletal proteins have an important role in aging process in human.
Molecular tools based on mitochondrial mutation for age estimation are often used to monitor the progression of aging. In old age, mitochondrial mutation is very large and is the cause for decline in cellular cyclooxygenase (COX) activity with progression of aging. Ca2+− stimulated adenylyl cyclase (ADCY) activity continues to decrease through advanced aging [55], which is consistent with the decrease in adenylate cyclase type 7 (ADCY7) in our result. Moreover, at the DNA level, accumulation of the 4977 bp deletion of mitochondrial DNA and the shortening of telomeres occurs. This is in agreement with the decreased gene expression of telomere maintenance 2 (TELO2) gene in our results. TELO2 is active as an S-phase checkpoint in the cell cycle and involved in telomere maintenance and sub telomeric gene expression. RUVBL2 regulates telomerase activity. In addition, telomerase reverses the aging process in mice, so RUVBL2 might be involved in the aging process by a DNA damage response pathway [56]. One highly interacting molecule, TGM2 (Tab. 1) is directly involved in the anti-apoptotic pathway [57]. Histone deacetylases (HDACs) affect histone acetylation and methylation and affect mRNA expression of pluripotent and proliferative genes of umbilical cord mesenchymal stem cells. Interestingly, we observed a deacetylase HDAC9 involved in the aging process, thus corroborating its possible involvement in aging. Mitogen-activated protein kinase 3 (MAPK3), a member of the MAPK family is involved in programmed cell death [58], and this is not just in plants. Even hypoxia and hyperglycemia are associated with MAPK3 signaling [59,60]. MAPK3 acts through augmented matrix metalloproteinase (MMP) expression on Neuregulin (NRG) and increases collagenase 3 expression by controlling myotubularin-related protein 5 (SBF1) related transcription factor [61]. Abnormal ROS levels can result in MAPK/PI3K signaling together with STAT3 activation Snail phosphorylation with E-Cadherin suppression and a loss of cell polarity and by this influencing apoptosis directly [62]. In terms of MAPK there are also the direct association with inflammation and cancer, e.g. via CXRC4/CXCR2, MAPK/PI3K signaling [63]. RuvB-like 2 (E. coli) is ubiquitous [64] modulating regulation of transcription via beta-catenin/TCF-LEF complex [65] and ATF2 [66]. Histone deacetylase 9 (HDAC9) is important for transcription and cell proliferation [67].
The immunopathological basis of aging
Another important category of aging during old age results from infections, inflammation, and degeneration of cellular and metabolic pathways. As humans grow older and begin to physiologically decline, an increased opportunity for pathogenic invasion occurs. In older individuals, altered production of cytokines and chemokines are age-related changes in the innate immunity process that are also important for pathogen resistance [68]. Human aging is generally accompanied by elevated systemic inflammatory conditions, a known biomarker of mortality rate in the elderly. Innate immune recognition by pathogens requires pattern recognition receptors (PRRs) that recognize conserved molecular structures of microbial origin and one of these categories is TLRs [69]. Attachment of TLRs on neutrophils stimulates phagocytosis of pathogens and release of antimicrobial peptides and chemokines. It recruits and activates other immune cells at the site of infection. Although the elderly preserve the number and phagocytic capacity of neutrophils, other functional characteristics of these cells are altered during aging. For example, receptor-driven functions such as superoxide anion production, chemotaxis, and apoptosis are reduced. Alterations in the membrane lipid rafts of neutrophils and decrease in signaling by specific receptors are involved in the defective function of neutrophils with advancing age [70], which is in agreement with altered expression of our TLRs such as TLR4, TLR5, cluster of differentiation 14 (CD14), and lymphocyte antigen 96 (LY96, MD2) of TLR pathway.
Most of the pathogenic pathways like the Staphylococcus aureus infection, systemic lupus erythematosus, pertussis, and Salmonella infection and other regulatory pathways, complement and coagulation pathways were all found to be activated during aging. In fact, the Staphylococcus aureus complement inhibitory protein Efb inhibits the complement activation pathway by blocking deposition of C3, whose expression increased in our study; thus, it is in agreement with complement and coagulation cascades [71]. Furthermore, in protein domain analysis we found CFB protein to be upregulated in aging, which is known to occur in mice. Similarly, in agreement with previous findings elsewhere, we noticed increased expression of C1S during aging [72].
Older individuals have less effective immunity due to challenges of infectious pathogens than in younger people because of complex changes collectively termed as immunosenescence. The instances of repeated reactivation of infectious diseases as well as the possible increased susceptibility to autoimmune diseases, and cancers in older individuals more so than in younger individuals have been associated in various species including human beings [73]. Regulatory molecules such as the up regulation of CD14, CD86, and cluster of differentiation 74 (CD74, human leukocyte antigen (HLA) class II histocompatibility antigen gamma chain) suggest a role in activation of microglia and pro-inflammatory cytokine secretion [74]. CD14 inhibits signaling involved in reduction of nitric oxide and proinflammatory cytokine production and increases anti-inflammatory signals. In addition, we found several pro-inflammatory cytokines like glycoprotein 130 (gp130), interleukin 13 receptor, alpha 1 (IL13RA1), and interferon regulatory protein factor 2 (IRF2) that are upregulated during aging [75]. Aging-associated changes in functions of neutrophils, macrophages, and dendritic cells are altered during aging [76]. The reduction of pathogen activity and lowering of antigen presentation capacity in aging is consistent with our observation of activated pathways of the Staphylococcus aureus infection, Systemic lupus erythematosus, Pertussis, Salmonella infection, tuberculosis, Legionellosis, and Leishmaniasis. Decreased endocytosis, antigen presentation, signal transduction, and cytokine production are associate with changes in plasmacytoid dendritic cells and myeloid dendritic cells in the aging process. Inflammatory responses caused by infection and pathogenic invasion in old age have been established by several investigations, which are in agreement with our pathways findings i.e., the Staphylococcus aureus infection, Systemic lupus erythematosus, Pertussis, Salmonella infection tuberculosis, Legionellosis, and Leishmaniasis which are possibly activated during the aging process.
There are several limitations associated with this study. Firstly, we do not have enough power in the analysis given the limited number of datasets available for such analysis, esp. where sex of the samples analyzed could not be established. Secondly, instead of a categorical data analysis approach, a multi-regression (continuous) analysis would have been far more informative. Thirdly, we relied on the tools already available and are open source, whereas one could develop newer tools or perform analysis using other commercially available tool sets. Lastly, although we found interesting insights using microarray data analysis approach alone, intensive integrative analysis using epigenomics, proteomics, and metabolomics datasets for similar categorical data would be far more informative and useful.
Our findings suggest that human aging is highly correlated with several disease-related pathways, thus demonstrating an immunopathological basis for it. Moreover, most of the gene-encoded proteins are nuclear-located AHNAK nucleoprotein (AHNAK), BCL6, PGR, BMP2K and are mostly up regulated. Furthermore, the integrative approach employed using publicly available microarray gene expression data sets and tools such as Limma and Aroma provided potential applications of these tools in data-mining for the unraveling of critical BPs in humans. This study provides a framework for an improved understanding of the dynamics of human aging with insights from immune regulation, and cytoskeletal architecture, and opens a new avenue towards the identification of molecular targets of aging in the near future.
List of abbreviations
ACSS3: Acyl-Coa Synthetase Short Chain Family Member 3
ADCY7: Adenylate Cyclase Type 7
BCL6: B-Cell Lymphoma 6 Protein
BMP2K: Bmp2 Inducible Kinase
BP: Biological Process
C1S: Complement Component 1S
C3: Complement Component 3
CASP8: Caspase-8
CC: Cellular Component
CD14: Cluster of Differentiation 14
CD86: Cluster of Differentiation 86
CFB: Complement Factor B
CFI: Complement Factor I
CFLAR: Fas-Associated Protein With Death Domain (Fadd)-Like Apoptosis Regulator
COX: Cyclooxygenase
CTTN: Src Substrate Cortactin
DAVID: Database For Annotation, Visualization And Integrated Discovery
EC: Enzyme Commission
FASR: First Apoptosis Signal Receptor
FCER1G: Fc fragment of IgE receptor Ig
FCGR2A: Fc fragment of IgG receptor IIa
FCGRT: Fc fragment of IgG receptor and transporter
FDR: False Discovery Rates
FKBP5: Binding Protein 5
FKBP51: FK506 binding protein 51
GEO: Gene Expression Omnibus
GO: Gene Ontology
GRK6: G Protein-Coupled Receptor Kinase 6
HDACs: Histone Deacetylases
KEGG: Kyoto Encyclopedia Of Genes And Genomes
LY96: Lymphocyte Antigen 96
MAPK3: Mitogen-activated protein kinase 3
MAP3K3: Mitogen-Activated Protein Kinase Kinase Kinase 3
MF: Molecular Function
MYLIP: Myosin Regulatory Light Chain Interacting Protein
NCBI: National Center For Biotechnology Information
NEK2: NIMA (never in mitosis gene a)-related kinase 2, NIMA2
p19ARF-p53: Protein 19 (P19) Alternate Reading Frame (P19Arf)-Protein 53 (P53)
PGR: Progesterone Receptor
QRSL1: Glutaminyl-Trna Synthase (Glutamine-Hydrolyzing)-Like 1
ROS: Reactive oxygen species
RUVBL2: RuvB-like 2 (E. coli)
SERPINA3: Serpin Family A Member 3
SRRM2: Serine/Arginine Repetitive Matrix Protein 2
STAT3: Signal Transducer And Activator Of Transcription 3
TELO2: Telomere Maintence 2
TLR4: Toll-Like Receptor 4
TLR5: Toll-Like Receptor 5
TREM2: Triggering Receptor Expressed On Myeloid Cells 2
UniProt: Universal Protein Resource
VEGF: Vascular Endothelial Growth Factor
VWF: Von Willebrand Factor
ZNF24: Zinc-Finger Protein 24
ZNRF1: E3 Ubiquitin-Protein Ligase ZNRF1
Supplementary material
Tables S1 to S25, Supplementary Figure 1, Supplementary information: Aroma Code. Access Supplementary Material
Author contribution statement
BPP carried out computational and statistical analysis. BPP and BBM drafted the manuscript. BPP and ANM conceived and designed the study. All authors read and approved the final version of the manuscript.
Conflict of interests
The authors declare that they have no conflict of interests.
Acknowledgments
The authors would like to acknowledge and the critical insights provided from all the reviewers Björn LDM Brücher, Ijaz S Jamall, Ray Perkins, and Sarah-Ellen Leonard for their constructive comments in improving the manuscript considerably.
References
- Park SK (2011), Genomic approaches for the understanding of aging in model organisms. BMB Rep 44, 291–297. [CrossRef] [Google Scholar]
- Morris JC, McManus DQ (1991), The neurology of aging: normal versus pathologic change. Geriatrics 46, 51–54. [Google Scholar]
- Weinert BT, Timiras PS (2003), Invited review: theories of aging. J Appl Physiol (Bethesda, Md.: 1985) 95, 1706–1716. [CrossRef] [Google Scholar]
- Capri M, Salvioli S, Sevini F, et al. (2006), The genetics of human longevity. Ann New York Acad Sci 1067, 252–263. [CrossRef] [Google Scholar]
- Kirkwood TBL (2002), Evolution of ageing. Mech Ageing Dev 123, 737–745. [CrossRef] [PubMed] [Google Scholar]
- Seviour EG, Lin SY (2010), The DNA damage response: balancing the scale between cancer and ageing. Aging. [Google Scholar]
- Liu L, Rando TA (2011), Manifestations and mechanisms of stem cell aging. J Cell Biol 193, 257. [CrossRef] [PubMed] [Google Scholar]
- Charville GW, Rando TA (2011), Stem cell ageing and non-random chromosome segregation, Philosophical Transactions of the Royal Society of London. Series B. Biol Sci 366, 85–93. [CrossRef] [Google Scholar]
- Kuilman T, Michaloglou C, Mooi WJ, Peeper DS (2010), The essence of senescence. Genes Dev 24, 2463–2479. [CrossRef] [PubMed] [Google Scholar]
- Uddin RK, Singh SM (2013), Hippocampal gene expression meta-analysis identifies aging and age-associated spatial learning impairment (ASLI) genes and pathways. PLoS ONE 8, e69768. [CrossRef] [PubMed] [Google Scholar]
- Rung J, Brazma A (2013), Reuse of public genome-wide gene expression data. Nat Rev Genet 14, 89–99. [CrossRef] [PubMed] [Google Scholar]
- Kanehisa M, Goto S (2000), KEGG: kyoto encyclopedia of genes and genomes. Nucleic Acids Res 28, 27–30. [CrossRef] [PubMed] [Google Scholar]
- Zhang B, Kirov S, Snoddy J (2005), WebGestalt: an integrated system for exploring gene sets in various biological contexts. Nucleic Acids Res 33, W741–W748. [CrossRef] [PubMed] [Google Scholar]
- Ramasamy A, Mondry A, Holmes CC, Altman DG (2008), Key issues in conducting a meta-analysis of gene expression microarray datasets. PLoS Med 5, e184. [CrossRef] [PubMed] [Google Scholar]
- Rhodes DR, Yu J, Shanker K, et al. (2004), Large-scale meta-analysis of cancer microarray data identifies common transcriptional profiles of neoplastic transformation and progression. Proc Natl Acad Sci USA 101, 9309–9314. [CrossRef] [Google Scholar]
- Rodwell GEJ, Sonu R, Zahn JM, et al. (2004), A transcriptional profile of aging in the human kidney. PLoS Biol 2, e427. [CrossRef] [PubMed] [Google Scholar]
- Edwards MG, Anderson RM, Yuan M, Kendziorski CM, Weindruch R, Prolla TA (2007), Gene expression profiling of aging reveals activation of a p53-mediated transcriptional program. BMC Genomics 8, 80. [CrossRef] [PubMed] [Google Scholar]
- Pan F, Chiu CH, Pulapura S, et al. (2007), Gene Aging Nexus: a web database and data mining platform for microarray data on aging. Nucleic Acids Res 35, D756–D759. [CrossRef] [PubMed] [Google Scholar]
- Weindruch R, Kayo T, Lee CK, Prolla TA (2002), Gene expression profiling of aging using DNA microarrays. Mech Ageing Dev 123, 177–193. [CrossRef] [PubMed] [Google Scholar]
- McElwee JJ, Schuster E, Blanc E, et al. (2007), Evolutionary conservation of regulated longevity assurance mechanisms. Genome Biol 8, R132. [CrossRef] [PubMed] [Google Scholar]
- Barrett T, Suzek TO, Troup DB, et al. (2005), NCBI GEO: mining millions of expression profiles—database and tools. Nucleic Acids Res 33, D562–D566. [CrossRef] [PubMed] [Google Scholar]
- Brazma APH, Sarkans U, Shojatalab M, et al. (2003), ArrayExpress − a public repository for microarray gene expression data at the EBI. Nucleic Acids Res 31, 68–71. [CrossRef] [PubMed] [Google Scholar]
- Berchtold NC, Cribbs DH, Coleman PD, et al. (2008), Gene expression changes in the course of normal brain aging are sexually dimorphic. Proc Natl Acad Sci USA 105, 15605–15610. [CrossRef] [Google Scholar]
- Phillips BE, Williams JP, Gustafsson T, et al. (2013), Molecular networks of human muscle adaptation to exercise and age. PLoS Genet 9, e1003389. [CrossRef] [PubMed] [Google Scholar]
- Pang WW, Price EA, Sahoo D, et al. (2011), Human bone marrow hematopoietic stem cells are increased in frequency and myeloid-biased with age. Proc Natl Acad Sci USA 108, 20012–20017. [CrossRef] [Google Scholar]
- Keller K, Engelhardt M (2013), Strength and muscle mass loss with aging process. Age strength loss, Muscles, Ligaments Tendons J 3, 346–350. [Google Scholar]
- Dönertaş HM, İzgi H, Kamacıoğlu A, He Z, Khaitovich P, Somel M. (2017), Gene expression reversal toward pre-adult levels in the aging human brain and age-related loss of cellular identity. Sci Rep 7, 5894. [CrossRef] [PubMed] [Google Scholar]
- Somel M, Guo S, Fu N, et al. (2010), MicroRNA, mRNA, and protein expression link development and aging in human and macaque brain. Genome Res 20, 1207–1218. [CrossRef] [PubMed] [Google Scholar]
- Bengtsson H, Simpson K, Bullard J, Hansen K (2008), aroma.affymetrix: a generic framework in R for analyzing small to very large Affymetrix data sets in bounded memory, methods. Tech Rep 745, 1–9. [Google Scholar]
- Heber S, Sick B (2006), Quality assessment of Affymetrix GeneChip data. Omics. J Integr Biol 10, 358–368. [CrossRef] [Google Scholar]
- Smyth GK (2004), Linear models and empirical bayes methods for assessing differential expression in microarray experiments, Stat Appl Genet Mol Biol 3, 1–25. [CrossRef] [Google Scholar]
- Yoav B, Yosef H (1995), Controlling the false discovery rate: a practical and powerful approach to multiple testing. J Roy Statist Soc Series B 57, 289–300. [Google Scholar]
- Bairoch A (2000), The ENZYME database in 2000. Nucleic Acids Res 28, 304–305. [CrossRef] [PubMed] [Google Scholar]
- Apweiler R, Bairoch A, Wu CH, et al. (2004), UniProt: the Universal Protein knowledgebase. Nucleic Acids Res 32, D115–D119. [CrossRef] [PubMed] [Google Scholar]
- Goldberg T, Hecht M, Hamp T, et al. (2014), LocTree3 prediction of localization. Nucleic Acids Res 42, W350–W355. [CrossRef] [PubMed] [Google Scholar]
- Martin A, Ochagavia ME, Rabasa LC, Miranda J, Fernandez-de-Cossio J, Bringas R (2010), BisoGenet: a new tool for gene network building, visualization and analysis. BMC Bioinform 11, 91. [CrossRef] [Google Scholar]
- Huang DW, Sherman BT, Lempicki RA (2009), Systematic and integrative analysis of large gene lists using DAVID Bioinformatics Resources. Nature Protoc 4, 44–57. [Google Scholar]
- Dennis G, Sherman BT, Hosack DA, et al. (2003), DAVID: database for annotation, visualization, and integrated discovery. Genome Biol 4, P3. [CrossRef] [PubMed] [Google Scholar]
- Gusnanto A, Calza S, Pawitan Y (2007), Identification of differentially expressed genes and false discovery rate in microarray studies, Curr Opin Lipidol 18, 187–193. Review [CrossRef] [PubMed] [Google Scholar]
- Pawitan Y, Michiels S, Koscielny S, Gusnanto A (2005), Ploner A. False discovery rate, sensitivity and sample size for microarray studies. Bioinform 21, 3017–3024. [CrossRef] [Google Scholar]
- Chen J, Bardes EE, Aronow BJ, Jegga AG (2009), ToppGene Suite for gene list enrichment analysis and candidate gene prioritization, Nucleic Acids Res 37, W305–W311. [CrossRef] [PubMed] [Google Scholar]
- Hong F, Breitling R (2008), A comparison of meta-analysis methods for detecting differentially expressed genes in microarray experiments. Bioinform 24, 374–382. [CrossRef] [Google Scholar]
- Tarca AL, Draghici S, Khatri P, et al. (2009), A novel signaling pathway impact analysis. Bioinform 25, 75–82. [CrossRef] [Google Scholar]
- Marchler-Bauer A, Lu S, Anderson JB, et al. (2011), CDD: a Conserved Domain Database for the functional annotation of proteins. Nucleic Acids Res 39, D225–D229. [CrossRef] [PubMed] [Google Scholar]
- Park SK, Prolla TA (2005), Lessons learned from gene expression profile studies of aging and caloric restriction. Ageing Res Rev, 4, 55–65. [CrossRef] [PubMed] [Google Scholar]
- Montecino-Rodriguez E, Berent-Maoz B, Dorshkind K (2013), Causes, consequences, and reversal of immune system aging. J Clin Investig, 123, 958–965. [CrossRef] [Google Scholar]
- Shvarts A, Brummelkamp TR, Scheeren F, et al. (2002), A senescence rescue screen identifies BCL6 as an inhibitor of anti-proliferative p19ARF-p53 signaling. Genes Dev 16, 681–686. [CrossRef] [PubMed] [Google Scholar]
- Jia D, Hasso SM, Chan J, et al. (2013), Transcriptional repression of VEGF by ZNF24: mechanistic studies and vascular consequences in vivo. Blood 121, 707–715. [CrossRef] [Google Scholar]
- Pei W, Bellows CG, Jia Y, Heersche JNM (2006), Effect of age on progesterone receptor expression, and osteoprogenitor proliferation and differentiation in female rat vertebral cell populations. J Endocrinol 190, 261–270. [CrossRef] [PubMed] [Google Scholar]
- Yang L, Kowalski J, Yacono P, et al. (2006), Endothelial cell cortactin coordinates intercellular adhesion molecule-1 clustering and actin cytoskeleton remodeling during polymorphonuclear leukocyte adhesion and transmigration. J Immunol (Baltimore, Md.: 1950) 177, 6440–6449. [CrossRef] [Google Scholar]
- Rao KM, Cohen HJ (1991), Actin cytoskeletal network in aging and cancer. Mutat Res 256, 139–148. [CrossRef] [PubMed] [Google Scholar]
- Zhou M, Wu R, Dong W, Leong J, Wang P (2010), Accelerated apoptosis contributes to aging-related hyperinflammation in endotoxemia. Int J Mol Med 25, 929–935. [PubMed] [Google Scholar]
- Giampietri C, Petrungaro S, Coluccia P, et al. (2010), c-Flip overexpression affects satellite cell proliferation and promotes skeletal muscle aging. Cell Death Dis 1, e38. [CrossRef] [PubMed] [Google Scholar]
- Jinwal UK, Koren J, Borysov SI, et al. (2010), The Hsp90 cochaperone, FKBP51, increases Tau stability and polymerizes microtubules. J Neurosci: Off J Soc Neurosci 30, 591–599. [CrossRef] [Google Scholar]
- Conti AC, Maas JW, Muglia LM, et al. (2007), Distinct regional and subcellular localization of adenylyl cyclases type 1 and 8 in mouse brain. Neuroscience 146, 713–729. [CrossRef] [PubMed] [Google Scholar]
- Jaskelioff M, Muller FL, Paik JH, et al. (2011), Telomerase reactivation reverses tissue degeneration in aged telomerase-deficient mice. Nature 469, 102–106. [CrossRef] [PubMed] [Google Scholar]
- Park SC, Yeo EJ, Han JA, et al. (1999), Aging process is accompanied by increase of transglutaminase C. J Gerontol Ser A, Biol Sci Med Sci 54, B78–B83. [CrossRef] [Google Scholar]
- Wu Q, Jackson D (2018), Detection of MAPK3/6 phosphorylation during hypersensitive response (HR)-associated programmed cell death in plants. Methods Mol Biol 1743, 153–161. [CrossRef] [PubMed] [Google Scholar]
- Hayashi Y, Toyomasu Y, Saravanaperumal SA, et al. (2017), Hyperglycemia increases interstitial cells of Cajal via MAPK1 and MAPK3 signaling to ETV1 and KIT, leading to rapid gastric emptying. Gastroenterology 153, 521–535. [CrossRef] [PubMed] [Google Scholar]
- Liu Y, Yang L, Yin J, et al. (2018), MicroRNA-15b deteriorates hypoxia/reoxygenation-induced cardiomyocyte apoptosis by downregulating Bcl-2 and MAPK3. J Investig Med 66, 39–45. [CrossRef] [Google Scholar]
- Seoane S, Montero JC, Ocaña A, Pandiella A (2016), Breast cancer dissemination promoted by a neuregulin-collagenase 3 signalling node. Oncogene 35, 2756–2765. Epub 2015 Sep 14. [CrossRef] [PubMed] [Google Scholar]
- Araldi RP, Módolo DG, de Sá Júnior PL, et al. (2016), Genetics and metabolic deregulation following cancer initiation: a world to explore. Biomed Pharmacother 82, 449–458. Epub 2016 Jun 1. Review. [CrossRef] [PubMed] [Google Scholar]
- Sobolik T, Su YJ, Wells S, Ayers GD, Cook RS (2014), Richmond A. CXCR4 drives the metastatic phenotype in breast cancer through induction of CXCR2 and activation of MEK and PI3K pathways. Mol Biol Cell 25, 566–582. [CrossRef] [PubMed] [Google Scholar]
- Salzer U, Kubicek M, Prohaska R (1999), Isolation, molecular characterization, and tissue-specific expression of ECP-51 and ECP-54 (TIP49), two homologous, interacting erythroid cytosolic proteins. Biochim Biophys Acta 1446, 365–370. [CrossRef] [PubMed] [Google Scholar]
- Bauer A, Chauvet S, Huber O, et al. (2000), Pontin52 and Reptin52 function as antagonistic regulators of Beta-catenin signalling activity. EMBO Journal 19, 6121–6130. [CrossRef] [Google Scholar]
- Cho S-G, Bhoumik A, Broday L, Ivanov V, Rosenstein B, Ronai Z (2001), TIP49b, a regulator of activating transcription factor 2 response to stress and DNA damage. Molecular and cellular biology 21, 8398–8413. [CrossRef] [PubMed] [Google Scholar]
- Zhao YX, Wang YS, Cai QQ, Wang JQ, Yao WT (2015), Up-regulation of HDAC9 promotes cell proliferation through suppressing p53 transcription in osteosarcoma. Int J Clin Exp Med 8, 11818–11823. [Google Scholar]
- Solana R, Pawelec G, Tarazona R (2006), Aging and innate immunity. Immunity 24, 491–494. [CrossRef] [PubMed] [Google Scholar]
- Kawai T, Akira S (2006), TLR signaling. Cell Death Differ 13, 816–825. [CrossRef] [PubMed] [Google Scholar]
- Fulop T, Larbi A, Douziech N, et al. (2004), Signal transduction and functional changes in neutrophils with aging. Aging Cell, 3, 217–226. [CrossRef] [PubMed] [Google Scholar]
- Lee LYL, Liang X, Höök M, Brown EL (2004), Identification and characterization of the C3 binding domain of the Staphylococcus aureus extracellular fibrinogen-binding protein (Efb). J Biological Chem 279, 50710–50716. [CrossRef] [Google Scholar]
- Welle S, Brooks AI, Delehanty JM, Needler N, Thornton CA (2003), Gene expression profile of aging in human muscle, Physiol Genomics 14, 149–159. [CrossRef] [PubMed] [Google Scholar]
- Vadasz Z, Haj T, Kessel A, Toubi E (2013), Age-related autoimmunity. BMC Med 11, 94 [CrossRef] [PubMed] [Google Scholar]
- Peferoen LA, Vogel DY, Ummenthum K, et al. (2015), Activation status of human microglia is dependent on lesion formation stage and remyelination in multiple sclerosis. J Neuropathol Exp Neurol 74, 48–63. [CrossRef] [PubMed] [Google Scholar]
- Savill J, Dransfield I, Gregory C, Haslett C (2002), A blast from the past: clearance of apoptotic cells regulates immune responses. Nat Rev Immunol 2, 965–975. [CrossRef] [PubMed] [Google Scholar]
- Ponnappan S, Ponnappan U (2011), Aging and immune function: molecular mechanisms to interventions. Antioxid Redox Signal 14, 1551–1585. [CrossRef] [PubMed] [Google Scholar]
Cite this article as: Parida BP, Misra BB, Misra AN. (2018), Visual gene network analysis of aging-specific gene co-expression in human indicates overlaps with immuno-pathological regulations. 4open, 1, 4.
All Tables
Top enrichment cluster displaying high enrichment score from David analysis for enzymes (Annotation Cluster 1, enrichment Score: 2.66).
Top five GO terms having maximum number enzymes in query list of Topp gene analysis.
All Figures
|
Fig. 1 Data selection process. |
| In the text | |
|
Fig. 2 (A) Box plots of 245 arrays of RLE; (B) Box Plots of 245 arrays of NUSE; (C) Aroma.affymetrix QN data; (D) SPIA two-way evidence plot. Each pathway is represented by one dot. The pathways at the right of the red oblique line are significant. |
| In the text | |
|
Fig. 3 Non Enzymatic proteins having interaction. Green and v shaped shows down-regulated and tringle and red shaped elements are up-regulated and their respective sizes are reflection of adjusted P-values. |
| In the text | |
|
Fig. 4 (A) GO analysis of all 185 genes derived from DAVID analysis having minimum Six genes and Fdr < 0.02; (B) GO analysis of the non-enzyme coding genes derived from DAVID Functional Analysis Chart minimum of four genes and Fdr cut off 0.02; (C) KEGG pathway all 185 genes derived from DAVID analysis having Minimum two genes. |
| In the text | |